

TL;DR: How an AI agent speeds up data analysis (and what you must control)
Try TicNote Cloud for Free to turn meeting decisions and assumptions into searchable evidence your analysis can reuse, then pair that evidence with your warehouse metrics for faster investigations. An ai agent for data analysis isn't just a chat answer. It's a system that can monitor signals, run a repeatable investigation, and publish artifacts.
You know the problem: KPI moves, and the context lives in meetings, docs, and DMs. That gap slows triage and creates rework. A practical fix is to capture and query your project knowledge in TicNote Cloud so the agent starts with grounded notes, decisions, and sources.
Agents differ from BI and copilots:
- Dashboards show predefined views and slices.
- Copilots help you write SQL or ask ad hoc questions.
- Agents follow an investigation playbook end to end, then push outputs like alerts, a short narrative, and a ticket or Slack update.
They help most when you need quick triage, consistent weekly reporting, and always-on checks that cut time to diagnosis.
Non-negotiables:
- A semantic layer or metrics store so "revenue" means one thing.
- Least privilege access, read-only by default.
- Audit logs for every tool call, query, and output.
What is an AI agent for data analysis, in plain terms?
An AI agent for data analysis is a helper that can run a full analysis loop for you. You give it a goal like "Why did net revenue drop?" It then pulls data, tests ideas, and writes up what it found. Unlike a chat tool, it can also use tools like SQL, a semantic layer (shared metric rules), and a safe Python sandbox.
The agent loop: observe, plan, use tools, verify, report and act
Agentic analytics works like a closed loop:
- Observe: a trigger starts it, like a schedule, an alert, or a Slack question.
- Plan: it lists tasks and hypotheses, such as "check churn vs pricing".
- Use tools: it runs NL to SQL, queries the semantic layer, or runs Python.
- Verify: it does sanity checks and second source checks.
- Report or act: it publishes a short report and clear next steps.
Autonomy matters. Some agents are interactive (you steer in chat). Others run in the background (monitoring). Many teams choose semi autonomous agents that can open a ticket, but can't change data.
Common outputs you should expect (not just "insights")
A good agent produces artifacts your team can reuse:
- SQL with comments and filters called out
- A short narrative in plain language
- A chart spec (what to plot, not a UI screenshot)
- A ticket assigned to an owner
- A Slack summary for fast sharing
- A confidence and caveats box
Make it evidence first. Each claim should link to the dataset, metric definition, and query log. Ideally you also get a notebook or run ID you can replay.
Where hallucinations happen (and how grounding prevents it)
Most errors are not wild fantasies. They are "plausible but wrong" mistakes:
- Metric drift: "net revenue" vs "gross revenue"
- Vague terms: "active user" means different things
- Missing filters: timezone, currency, refunds
- Wrong joins that double count rows
- Stale tables or late arriving data
Grounding reduces this risk. Use a semantic layer for metric truth, RAG (retrieval augmented generation) over curated docs, and tool allowlists. Also require citations to tables, docs, and transcripts inside your workspace.
Which data analysis jobs should you automate first (and which should stay human-led)?
Start with work that is repeatable, low risk, and easy to check. That's where an ai agent for data analysis can save the most time without making big decisions for you. A good rule: automate the "detect and summarize" steps first, then keep "decide and approve" with humans.
Start with high-ROI, low-drama workflows
These are fast wins because the agent runs the same checks every time.
- KPI monitoring: pick 5 to 10 KPIs, set thresholds, add simple seasonality rules (like week-over-week), and run freshness checks (did the data load?).
- Anomaly triage: when a KPI moves, have the agent re-cut the data the same way each time. Use standard slices like channel, geo, device, and product line, then write a short "what changed" summary.
- Weekly business reviews: generate a weekly pack from a fixed outline. Include a clear "exceptions" section that lists the 2 to 5 biggest deltas, plus the top drivers.
Keep outputs tight. Every chart or claim should point back to a query result or table.
Keep high-stakes calls human-led (with sign-off gates)
Early on, don't let an agent finalize decisions in these areas:
- Finance: revenue recognition, close adjustments, forecasts that move guidance
- Regulated decisions: lending or credit actions, healthcare recommendations
- People impact: layoffs, comp changes, performance actions
Instead, define "human sign-off gates":
- Escalate when: impact is material, data is incomplete, or results conflict.
- Require evidence: the KPI definition, the exact filters, key SQL checks, and a list of assumptions.
- Assign an approver: finance owner, data governance lead, or domain GM.
Use a simple prioritization matrix (value × risk × data readiness)
Score each idea from 1 to 5 on three axes.
| Factor | What to score | 1 | 3 | 5 |
| Value | Time saved and decision speed | Small | Medium | Large |
| Risk | Harm if wrong | Low | Medium | High |
| Data readiness | Can the agent query safely and consistently? | Weak | Mixed | Strong |
Decision rule: start with high value (4 to 5), low risk (1 to 2), and strong readiness (4 to 5).
Data readiness checks to pass before you automate:
- Stable metric definitions (no "everyone calculates it differently")
- Freshness SLAs (how late is "late"?)
- Documented dimensions (channel, region, product)
- Known join paths (which tables connect, and how)
Finally, keep scope small: start with one KPI in one domain, evaluate results, then expand.
How do you design a reference architecture for an analytics agent?
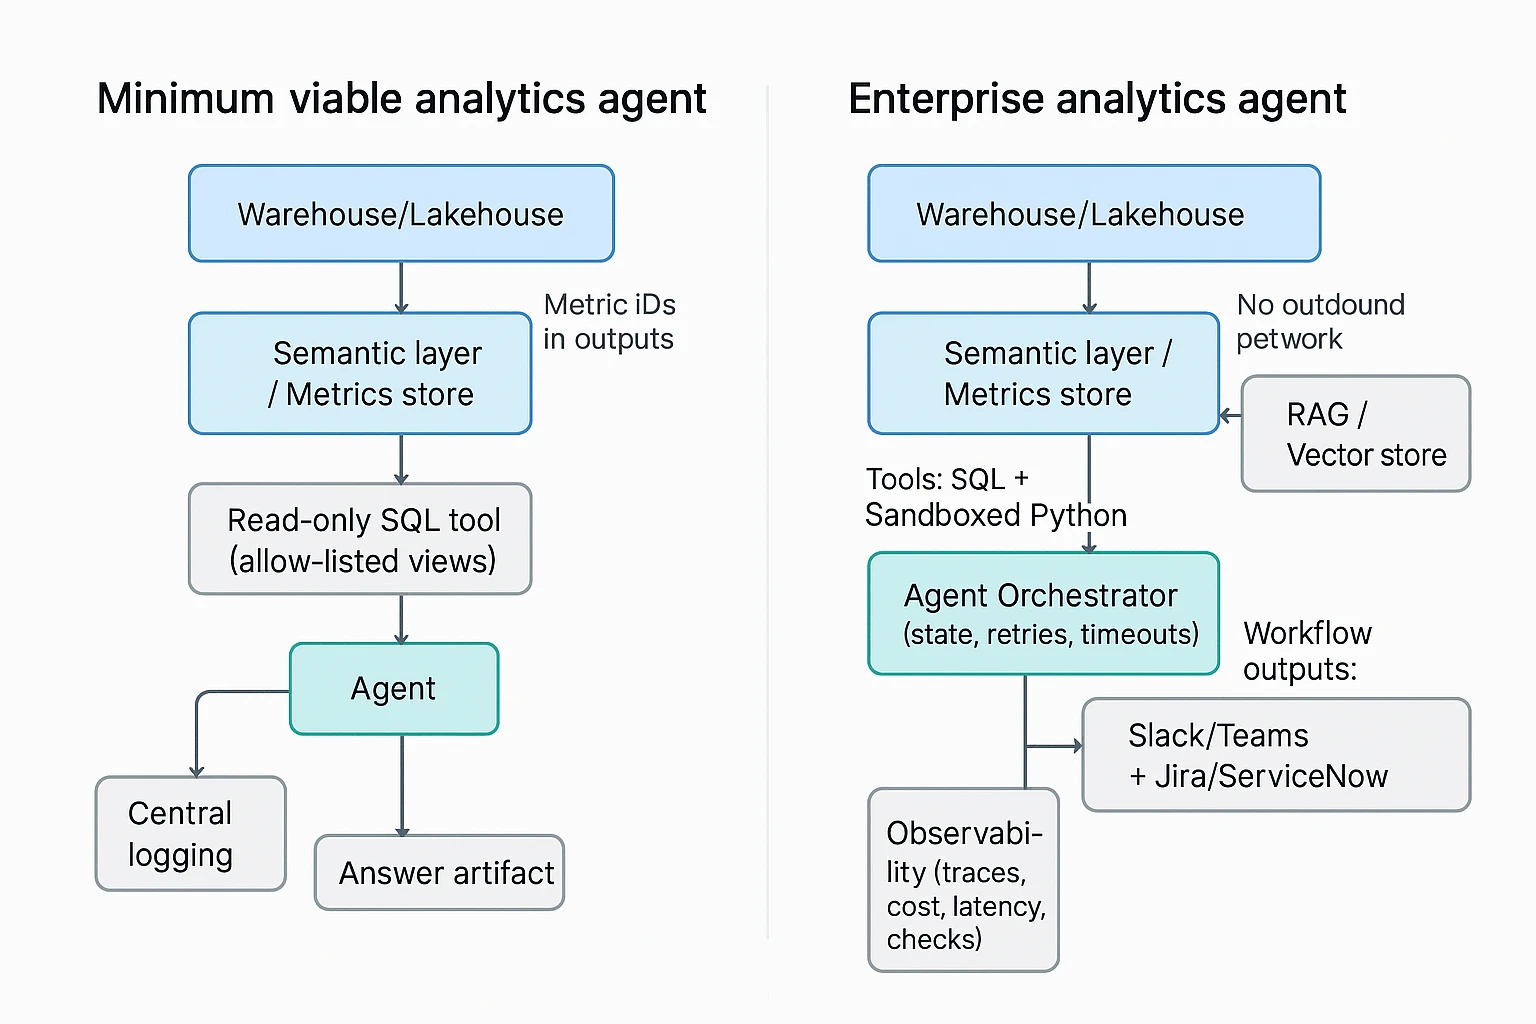
A good architecture makes an analytics agent fast, repeatable, and safe. The goal is simple: let the agent ask questions, pull evidence, and draft findings, without giving it free access to your data stack. Below are two reference designs you can adapt, from minimum viable to enterprise.
Minimum viable stack (ship value fast, reduce risk)
This is the smallest setup that can still support reliable investigations.
- Warehouse or lakehouse (system of record): Snowflake, BigQuery, Databricks, Redshift, or similar. The agent should never "calculate truth" from raw app exports if a governed table exists.
- Semantic layer or metrics store: A central place that defines metrics once (like revenue, churn, active users), plus allowed dimensions, time grains, and access rules. It prevents metric drift between teams.
- Read-only SQL tool (allow-listed): The agent can only query approved schemas or views. Prefer parameterized queries, and block ad hoc access to raw PII tables.
- Central logging: Store prompts, tool calls, SQL text, row counts, errors, and the final narrative. This is how you debug bad answers and prove what happened later.
If you build only one guardrail at first, make it the semantic layer plus read-only access. Everything else can evolve.
Enterprise blueprint (scale across teams and use cases)
Once the agent runs real investigations, you'll need more than NL to SQL.
- RAG for analytics (retrieval augmented generation): A curated knowledge set the agent can cite, like data catalog excerpts, metric definitions, runbooks, dashboards, and prior incident RCAs. This helps it choose the right tables and the right "next check," not just write fluent text.
- Orchestration and agent state: A scheduler plus a state store (memory scoped to one case). Add retries, timeouts, and step limits so one bad query doesn't spiral cost.
- Sandboxed Python (for stats and checks): Controlled packages, no outbound network by default, and strict row and compute limits. Use this for things SQL is clumsy at, like seasonality tests, changepoint detection, or small joins for validation.
- Observability for the agent itself: Traces across steps, cost and latency tracking, pass fail checks (for example, "did we query the semantic layer"), plus alerting when the agent starts failing or behaving oddly.
- Workflow outputs and handoff: Push summaries and evidence links to Slack or Teams, and open Jira or ServiceNow tickets with clear ownership. The agent should help teams act, not just "answer."
Tip: when you design this, also design the failure mode. What should happen when the agent can't access a table, hits row limits, or sees conflicting metric definitions?
Why the semantic layer prevents inconsistent answers
Most "agent hallucinations" in analytics are really definition problems. Classic example: "active users" can mean any of these.
- Logged in within 30 days
- Opened the app within 7 days
- Had at least one billable event within a month
If the agent can pick any definition, two runs can produce two "correct" but incompatible answers.
A semantic layer or metrics store reduces this by enforcing:
- Metric definitions: One formula, one source of truth.
- Joins and dimensions: Approved join paths, so the agent can't create fanout errors.
- Time zone and time grain: Day vs week vs month, plus consistent time zone rules.
- Currency and conversions: A single policy for FX rates and reporting currency.
- RLS and CLS (row and column level security): The agent inherits user permissions and never "sees" restricted rows or columns.
One extra guardrail that works well: require the agent to reference metric IDs (not just names) in outputs. For example, "MAU metric_id: metric_0142" plus the time grain and filters used. That makes reviews fast, and audits possible.
Reference architecture checklist
Use this as a quick design review before you build.
- Can the agent query only governed views or metric endpoints (not raw tables)?
- Are key metrics defined in one semantic layer with time zone and currency rules?
- Do logs capture prompts, SQL, row counts, errors, and final answer artifacts?
- Is agent memory scoped to a single case, with timeouts and retry limits?
- Is Python analysis sandboxed with package, compute, and data egress controls?
- Can the agent retrieve and cite runbooks, catalog notes, and past RCAs?
- Do you have observability for cost, latency, and failure rates per investigation?
- Can the agent hand off outputs into Slack or ticketing with clear ownership?
If you also want upstream evidence to feed these workflows, it helps to standardize how meeting decisions and assumptions get captured. Many teams use all in one AI workspace tools to turn meeting notes into searchable, analysis ready context the agent can retrieve later.
How do you implement an AI agent for data analysis step by step?
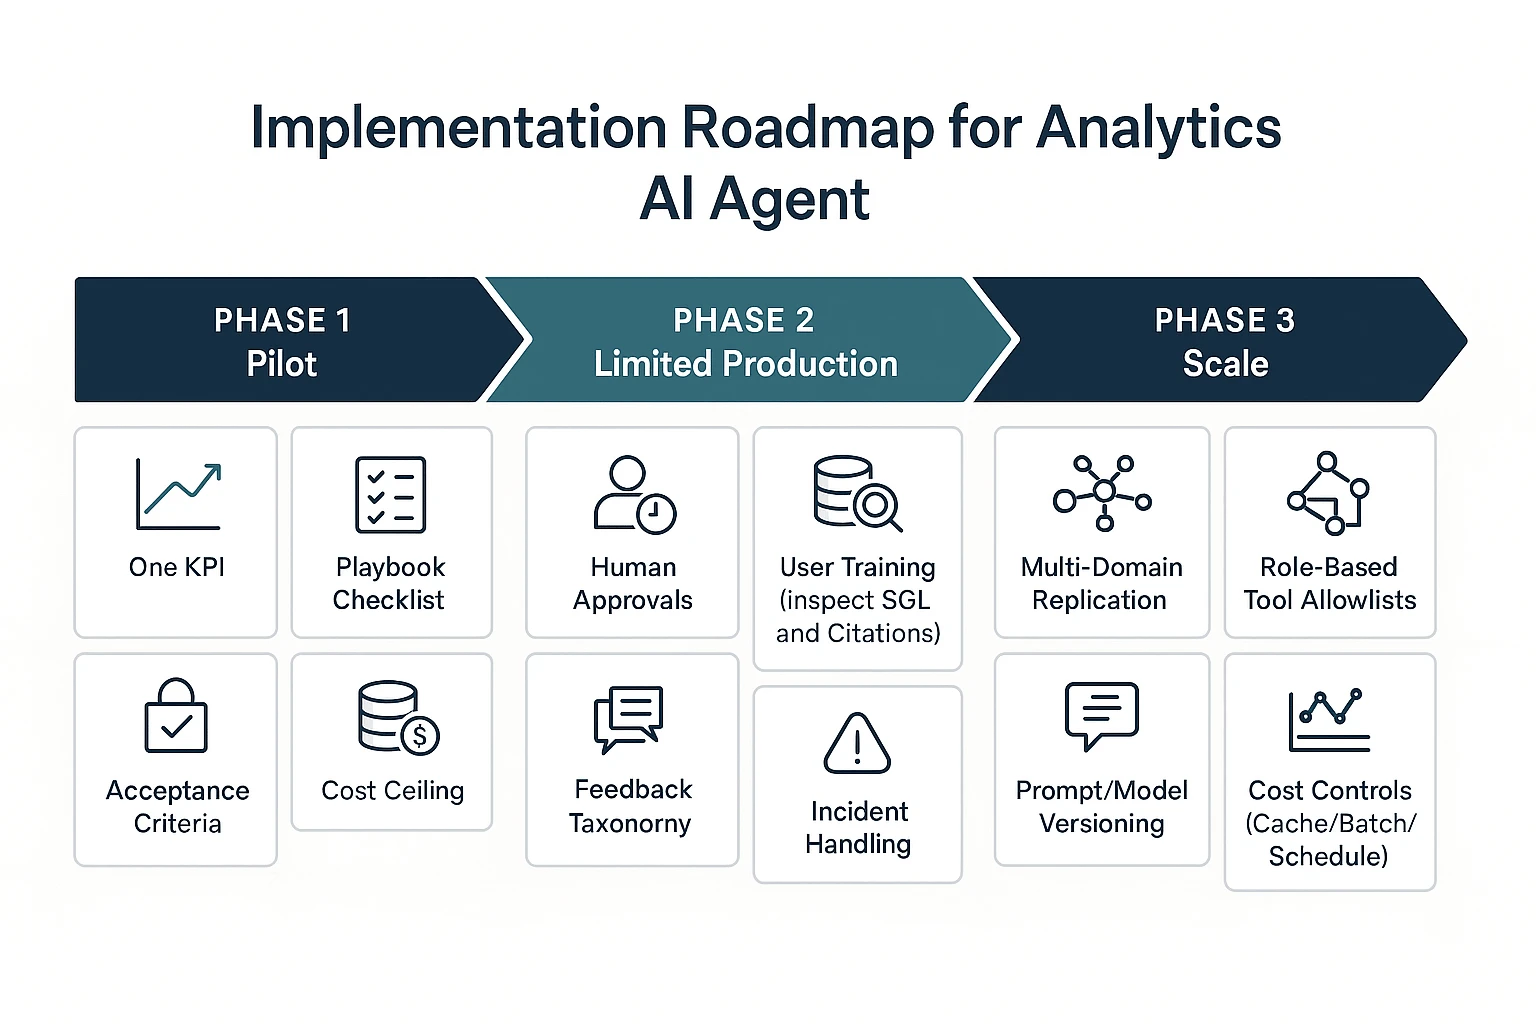
Implementing an AI agent for data analysis works best as a phased rollout. You start with one KPI and tight limits, then add approvals and runbooks, then scale to more domains with drift and cost controls. This approach keeps speed gains, but stops bad queries and wrong alerts from spreading.
Phase 1 (pilot): one KPI, one playbook, read-only access
Pick a single KPI that's stable and has clear owners. Good examples are "weekly active users" or "net revenue retention", not "North Star" composites that change often. Keep the scope narrow so you can tell if the agent helps.
Write one investigation playbook the agent must follow. Treat it like a checklist, not a chat. Include:
- Trigger: what event starts the run (alert, Slack question, ticket)
- Checks: data freshness, missing partitions, outliers vs last week
- Segments: splits that usually explain moves (region, channel, plan, device)
- Validation: a second query or alternate source to confirm
- Output format: short answer, evidence, SQL, and next steps
Then lock down access and cost from day one:
- Read-only views only (no raw tables if you can avoid it)
- Safe defaults like LIMITs and sampling
- Query timeouts and a cost ceiling per run
- A sandboxed environment for any Python work (no network calls)
Define acceptance criteria before you pilot. Keep them concrete:
- SQL correctness threshold (for example, "joins and filters match the semantic layer")
- Acceptable false alerts (how often it flags a "problem" that isn't real)
- Max latency (how long users will wait for an investigation)
Phase 1 readiness checklist:
- Semantic layer exists (a shared metric definition source)
- Data freshness is monitored and visible
- KPI owners are on-call for definition questions
- There's a place to store evidence (ticket thread, doc, or case log)
Phase 2 (limited production): approvals, on-call, runbooks, user training
Once the pilot is useful, the next risk is blast radius. Phase 2 is about adding humans in the loop for anything that can move work, money, or customer messaging.
Add approvals for high-impact actions, such as:
- Posting to exec channels
- Creating incident tickets
- Paging on-call
- Sending messages to customers or sales teams
Create short runbooks for failure modes you will see in the real world:
- "Agent wrong answer": how to reproduce, correct, and label the root issue
- "Data late": how to detect lateness and how the agent should respond
- "Permission denied": how to request access or route to a data owner
- "Metric definition changed": how to update the semantic layer and prompts
Train users on two skills: asking good questions and reading evidence. Most teams skip the second part. Make it normal to inspect the SQL, the filters, the time window, and the cited sources before acting.
Finally, capture feedback in a structured way. "Thumbs down" alone isn't actionable. Map feedback to categories such as:
- Wrong metric definition
- Wrong join or grain mismatch
- Missing context (needed a business event or launch calendar)
- Hallucinated claim (no supporting evidence)
- Output format not usable
Phase 3 (scale): multi-domain agents, cost controls, drift monitoring
After limited production, scale by copying patterns, not by expanding one giant agent prompt. Add new domains (marketing, product, ops) only when each has a defined semantic layer, owners, and playbooks.
Automate governance so it doesn't become a manual gate:
- Tool allowlists by role (which datasets, which functions, which actions)
- Approval routing (who signs off by domain and severity)
- Prompt and model versioning (so you can roll back regressions)
- Audit evidence (store the question, SQL, results, and final message)
Add drift monitoring, because the world changes faster than prompts:
- Schema drift: columns change, tables move, types shift
- Metric definition drift: "active" or "revenue" meaning changes
- Prompt regressions: a new prompt breaks a known good workflow
- Seasonal shifts: normal patterns look "anomalous" without context
Put cost controls in place before usage spikes:
- Caching common queries and common explanations
- Batching related questions into one run
- Query rewriting to reduce scans (push filters early)
- Scheduled investigations for recurring questions vs ad-hoc runs
Go/no-go checklist: Phase 1 to 2 to 3
Use this to decide if you're ready to move forward:
- Phase 1 → Phase 2: The agent meets your correctness and latency goals, KPI owners trust the evidence format, and you can trace every answer back to SQL and sources.
- Phase 2 → Phase 3: Approvals and runbooks work in practice, feedback categories show falling error rates, and you have drift and cost monitoring that can trigger fixes.
Image idea: Pilot → Limited production → Scale, with added controls per phase.
What does a real investigation workflow look like (example walkthrough)?
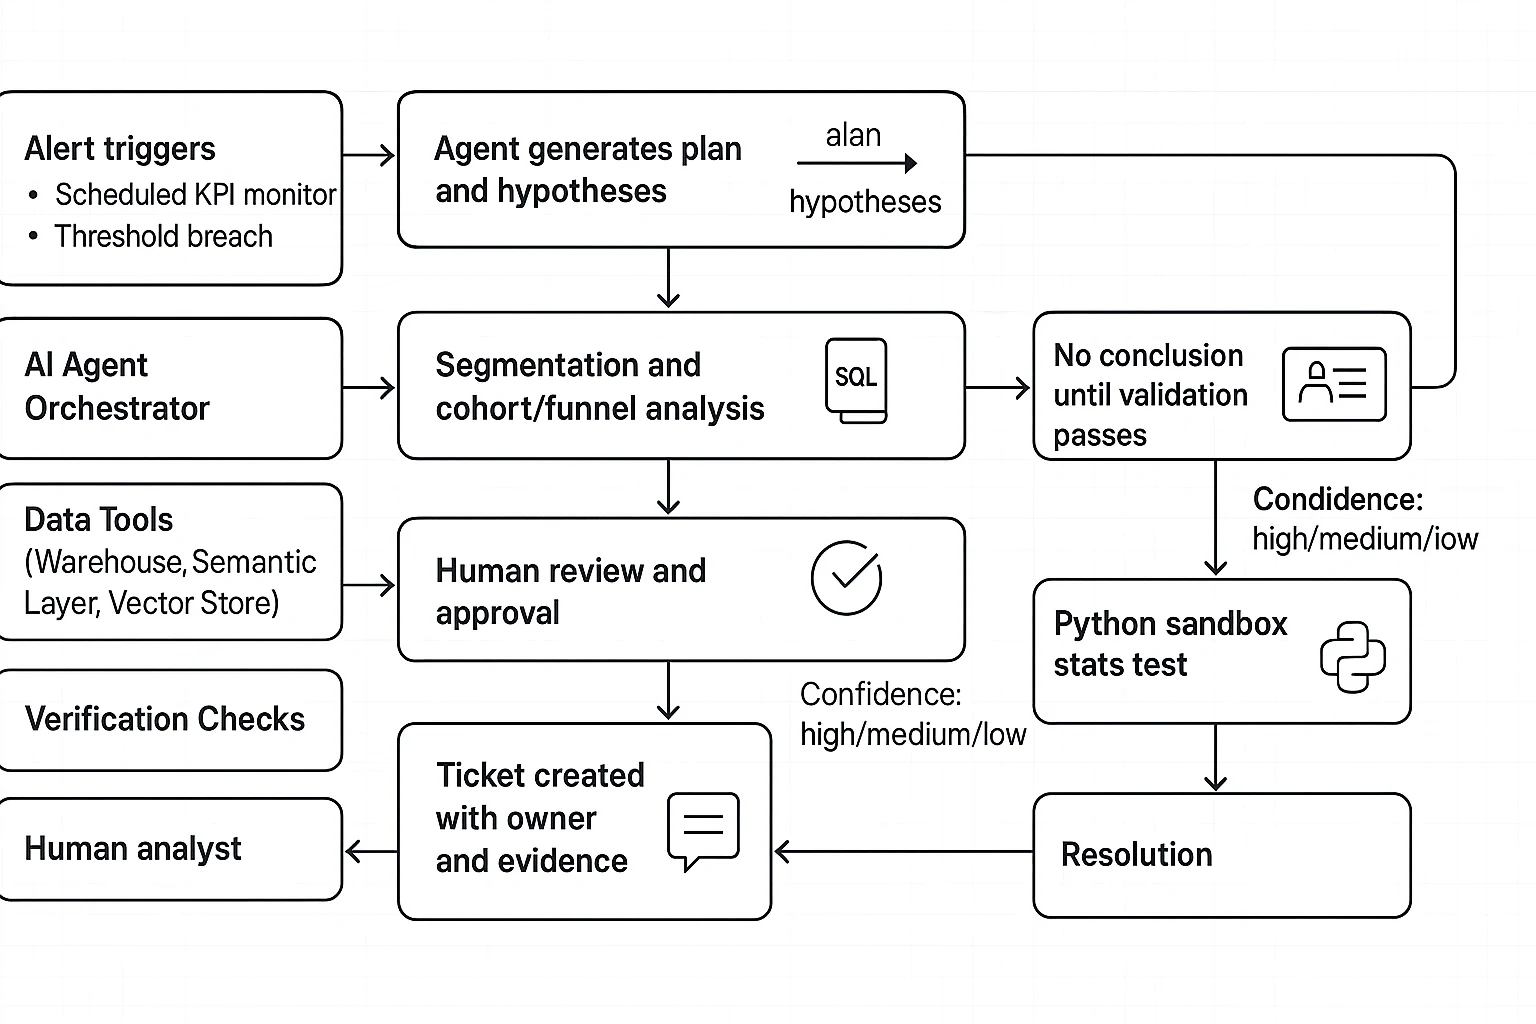
Here's a realistic root cause analysis (RCA) flow for a revenue dip, written as if an analytics agent is helping. The goal is speed without guessing. So every "insight" stays a hypothesis until it passes checks, uses the metric definition in your semantic layer, and can be reproduced.
Trigger: alert fires, agent writes a plan (not a conclusion)
Trigger types
- A scheduled KPI monitor (daily revenue vs trailing 28 day average)
- An alert threshold (revenue down more than 8% day over day)
Agent's first output: an investigation plan
- Restate the problem: "Revenue is down 9.6% on 2026-03-11 vs 7 day average."
- List hypotheses (ranked by likely impact):
- Traffic drop (sessions down)
- Conversion drop (CVR down)
- AOV drop (pricing, discounting, mix shift)
- Refunds or chargebacks up
- Reporting issue (late data, broken join, duplicate events)
- List required datasets:
- Orders, order items, payments, refunds
- Sessions or visits, attribution tables
- Product, geo, device dimensions
- Calendar table (holidays, promos)
- Decision points:
- "If data freshness fails, stop and page data on call."
- "If revenue drop is isolated to one channel, focus there next."
Guardrail: the agent must say, in plain text, "No root cause yet. Validation steps pending."
Execution: verify first, then slice, then test
Step 1: confirm freshness and pipeline health
Before any deep dive, the agent checks:
- Latest
loaded_atin fact tables - Row counts vs yesterday
- Null spikes in key fields (order_id, amount, currency)
- Duplicate keys (order_id appears more than once)
If any of these fail, the output is "data may be incomplete" and the agent switches to incident mode.
Step 2: recompute the KPI from the semantic layer
The agent recomputes revenue using the canonical metric (same filters, same grain). This prevents "metric drift" across teams.
Expected NL to SQL output quality:
- Parameterized dates (
:start_date,:end_date) - Comments that explain intent
- Safe limits when previewing
- No
SELECT *
Example (preview query):
- Uses a clear date window
- Shows both current day and baseline
- Keeps joins minimal
Step 3: decompose revenue into drivers
The agent breaks revenue into:
- Sessions (or visits)
- Conversion rate (orders per session)
- Average order value (AOV)
- Refund rate
Then it runs the same breakdown by:
- Channel (paid search, organic, email)
- Geo
- Device
- Product category
- New vs returning
At each cut, it runs sanity tests:
- Join cardinality check (no 1 to many explosion)
- Dedupe check on events
- Totals reconcile back to overall revenue (within tolerance)
Step 4: cohort and funnel checks (when it fits)
If conversion is down, the agent inspects the funnel:
- Landing page view
- Product view
- Add to cart
- Checkout start
- Purchase
It looks for the first step with a sharp drop, then segments that step (device, browser, country). This narrows the search fast.
Optional: Python sandbox for a quick stats check
When a pattern looks real, the agent can run a small, reproducible test in a sandboxed notebook:
- Two proportion z test on conversion (day vs baseline)
- Anomaly score on hourly revenue
- Fixed seed for any sampling (for repeatability)
Example expectation: "Set seed=42, log package versions, and save the exact query result used."
Output: cited evidence, confidence, and next actions
A strong agent output reads like an incident note. It includes:
- Narrative (5 to 8 lines): what changed, where, and when
- Top drivers: "Paid Search mobile conversion down 18% in US."
- Supporting artifacts:
- Query links or stored SQL text
- A chart spec (metric, dimensions, time grain)
- Sanity check results (row counts, null rates, dedupe)
- What we did not check: refunds latency, offline sales, partner feeds
Confidence rubric
- High: metric recomputed from the semantic layer, freshness passed, totals reconciled, segment is stable, and change is statistically supported.
- Medium: freshness passed, and pattern is consistent, but attribution is noisy or the sample is small.
- Low: data quality warnings, incomplete partitions, or results don't reconcile.
Next actions (ticket plus owner)
- Create a ticket: "Investigate mobile checkout errors in US Paid Search."
- Assign an owner (growth eng or web platform)
- Attach evidence: SQL, chart spec, time window, affected cohorts
- Suggest follow-ups: browser logs, release diff, experiment flags
Also pull upstream evidence. Recent meeting decisions often explain moves. For example: "Promo paused on 03-10" or "Checkout release shipped at 14:00 UTC." If you capture these decisions in a searchable project space, the agent can cross-check assumptions before it points fingers.
Mini postmortem: make the next one faster
After resolution, add three items to your playbook:
- A new monitor (for the first broken funnel step)
- A saved investigation template (queries plus sanity checks)
- A short "known causes" note (release types, common data breaks)
That's how an analytics agent becomes a repeatable system, not a one-off chatbot.
How do you evaluate agent quality and ROI without guessing?
Don't judge an analytics agent by a few good answers. Treat it like any other system: define what "good" means, test it before rollout, then watch it in production. Your framework should cover four things: correctness (is it right), trust (can we verify it), speed (is it faster), and cost (is it worth it).
Offline tests: prove it's right before it ships
Offline tests catch the silent failures that look fine in a chat window. Start by building a labeled test set of real questions and incidents your team sees often. For each item, store the expected output artifacts, not just a "final answer".
Include these checks:
- SQL correctness
- Syntax passes, and queries run.
- Uses the right tables or governed views.
- Applies the right filters, joins, and grain (row level).
- Has safe limits and won't scan huge ranges by default.
- Grounding and citations
- The agent must cite the metric definition it used.
- It must cite source tables, views, or approved docs.
- If it can't cite, it must say what's missing.
- Regression suites
- Re-run the same test set on every model, prompt, tool, or semantic-layer change.
- Track deltas: which cases improved, regressed, or became slower.
Tip: store "expected SQL patterns" (key clauses, required filters) instead of one exact query. It reduces false test failures when formatting changes.
Online metrics: measure investigation outcomes, not vibes
Once it's live, focus on outcomes your org already cares about. Pair each metric with an owner and a review cadence.
Operational KPIs to track:
- Time-to-diagnosis: median and p95 minutes from question to validated root cause.
- RCA hit rate: percent of investigations where humans confirm the root cause analysis.
- False alert rate and missed incident rate (if the agent monitors anomalies).
- Analyst hours saved: time saved per week, based on tagged work or sampling.
- Adoption: weekly active users, repeat usage, and "investigations completed".
Add explicit trust signals:
- Evidence package completeness rate: percent of outputs that include (1) SQL or notebook cell references, (2) metric definition used, (3) cited sources, and (4) a short list of checks run.
Cost and latency: set a budget per investigation
If you don't set guardrails, cost and wait time will drift. Define a target budget per investigation that includes compute plus LLM token spend, then enforce it.
Common guardrails:
- Query caching for repeat questions and common slices.
- Batching related sub-questions into fewer tool calls.
- Early stopping when a required check fails (for example, missing metric definition).
- Timeouts for long queries and long agent loops.
Here's a simple scorecard you can use in ops reviews:
| KPI | Target | Current | Notes |
| Time-to-diagnosis (median) | 30 min | ||
| Time-to-diagnosis (p95) | 90 min | ||
| RCA hit rate | 80% | ||
| Evidence package completeness | 95% | ||
| False alert rate | 5% | ||
| Cost per investigation | $2.00 |
Finally, set baselines before rollout. Sample 20 to 50 past investigations, measure today's time, cost, and accuracy, then compare after launch. That's how you get real ROI, not anecdotes.
How do you handle security, privacy, and governance for analytics agents?
Security for analytics agents isn't a single feature. It's a set of controls that limit what the agent can see, what it can do, and how you prove it behaved correctly. Treat the agent like a new employee with fast hands: helpful for investigations, risky without guardrails.
Lock down access with RBAC, RLS, and PII-safe patterns
Start with least privilege. Split agent capabilities into separate roles, so one permission can't turn into full data exfiltration.
- "Ask" role (default): can read approved docs and metadata, but can't run queries.
- "Run SQL" role: can execute read-only SQL in approved schemas. No DDL (create/alter) and no writes.
- "Create tickets / notify" role: can post to Slack or create Jira tickets, but can't access raw tables.
For data access, rely on controls your warehouse already enforces:
- Row-level security (RLS): limit rows by user, team, region, or account.
- Column-level security (CLS): hide sensitive columns by role.
- Semantic layer views: publish "analysis views" that already apply RLS/CLS, so the agent never touches base tables.
For PII (personally identifiable information), assume prompts will sometimes include it. Design for "safe by default" handling:
- Denylist sensitive columns (email, phone, SSN, precise address) in the agent's SQL tool.
- Redact or tokenize values before the model sees them (for example, replace emails with stable hashes).
- No raw export rules: block large result downloads, clipboard dumps, and file writes that contain raw PII.
Control tool access with allowlists, approvals, and change management
Agents feel powerful because they can use tools. That's also where you reduce blast radius.
Use a tool allowlist with clear scopes:
- SQL (read-only) to specific datasets
- Python in a sandbox (no network, no local file system, quota limits)
- Ticket creation with required fields (severity, owner, evidence links)
- Notifications only to approved channels
Add approval workflows for actions that create impact:
- Agent drafts a plan and proposed message or ticket.
- Human approves when it crosses a threshold (broad notification, incident creation, exec-facing summary).
- Agent executes only the approved step, then logs the outcome.
Finally, manage prompts and models like production code:
- Version prompts and tool policies with owners and review dates.
- Release notes for every change (what changed, why, expected risk).
- Rollback procedure that can revert the agent to last known good behavior in minutes.
Build audit evidence and a real incident response loop
If you can't reconstruct what happened, you can't govern it. Log the full chain of actions, not just the final answer:
- User request and user identity
- Agent plan (steps it intended to take)
- Tool calls (including parameters)
- SQL text, datasets touched, row counts returned
- Any redaction applied
- Output shown to the user
- Approvals and who approved
Review needs a rhythm:
- Weekly sample review: check a small set of investigations for policy violations and quality issues.
- Incident-based deep dive: pull full traces when a data access issue, hallucination, or bad alert occurs.
Your incident response should be explicit:
- Freeze the agent version (prompt, tools, model) used in the event.
- Collect logs and reproduce in a safe sandbox.
- Patch the policy (tool allowlist, denylist columns, approval thresholds).
- Retest before re-enabling automation.
Quote box idea (Data Governance Lead): "I don't care how autonomous the agent is. I care that every query, dataset, and decision is auditable. Auditability beats autonomy in enterprise analytics."
What is a practical alternative: using meeting knowledge to produce analysis-ready evidence?
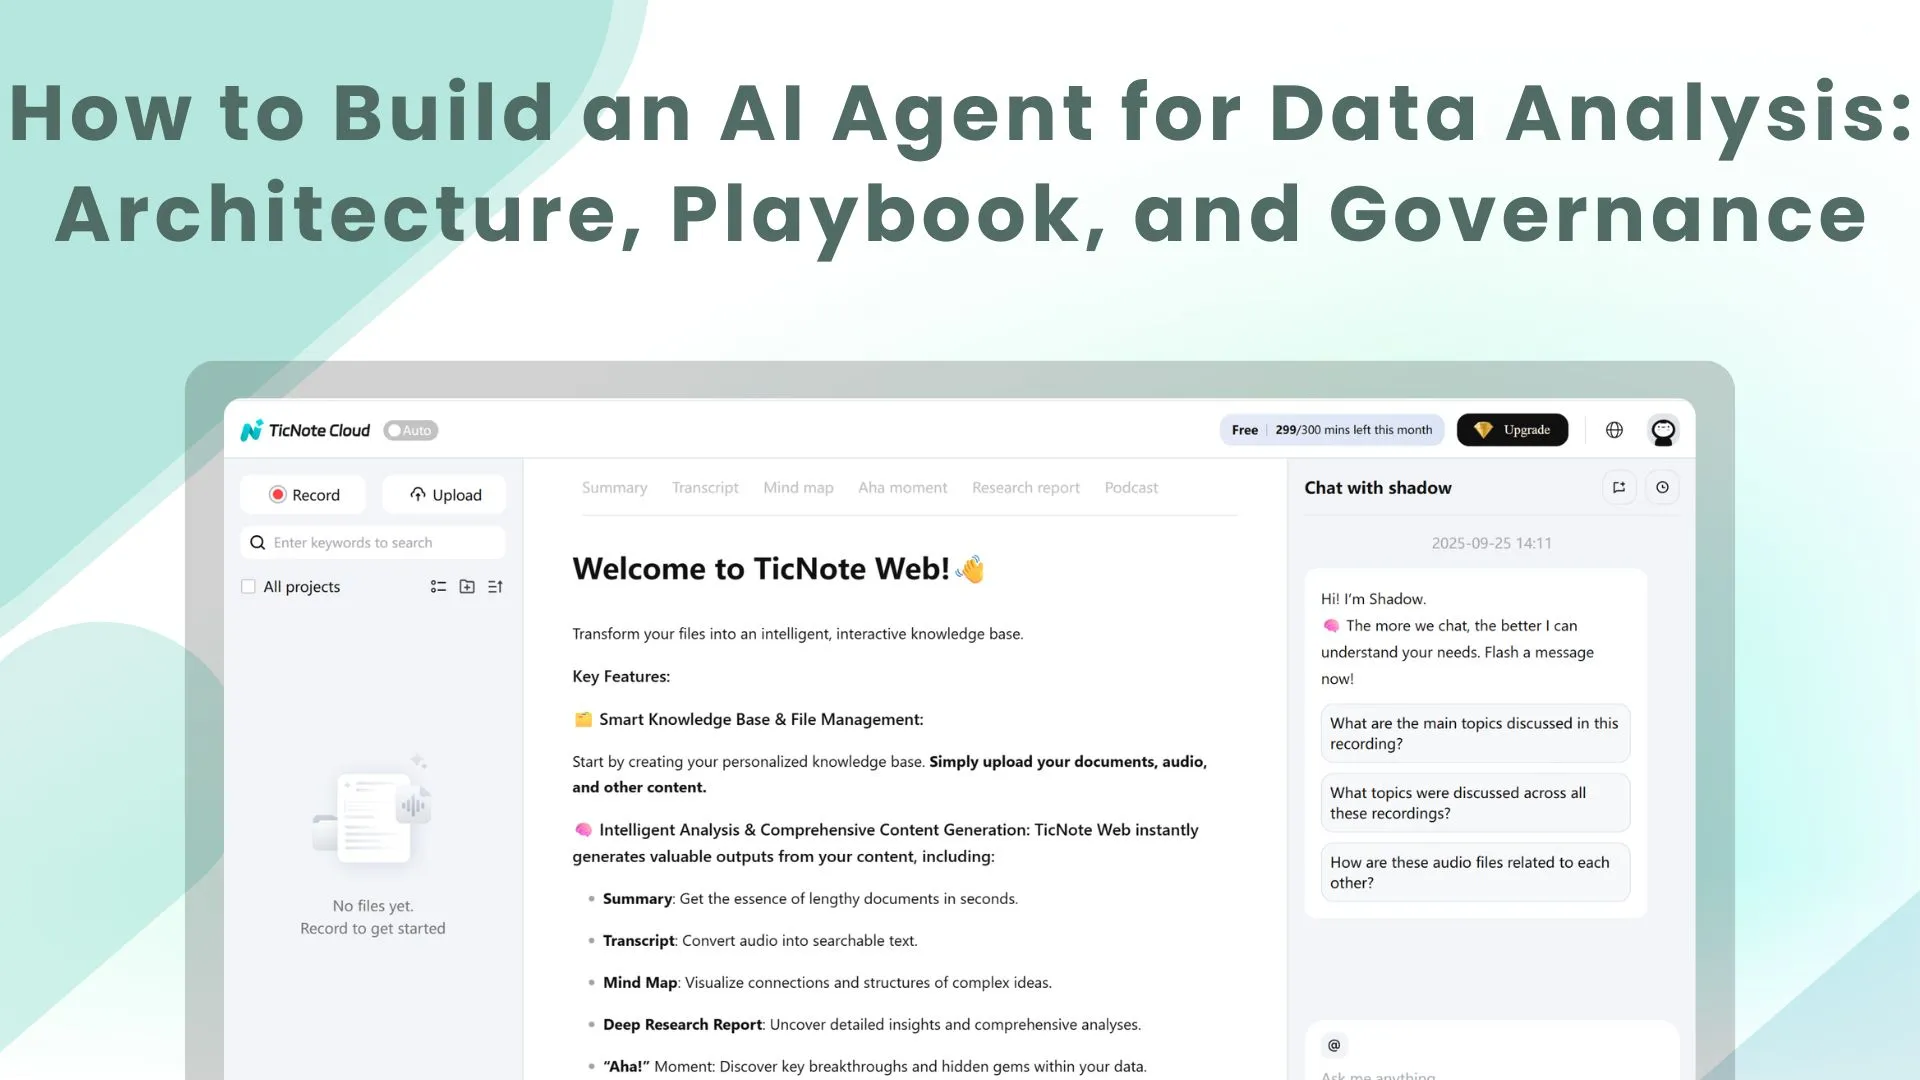
If your analysis work often starts with, "What changed?" then a practical alternative is to capture meeting and document knowledge as evidence, then hand that evidence to your warehouse and BI tools. Below, I'll show the steps using TicNote Cloud as an example system for intake, grounded Q&A, and deliverables, while keeping the core workflow tool-agnostic. It's especially helpful when you're building an ai agent for data analysis and you need clean context before you run SQL.
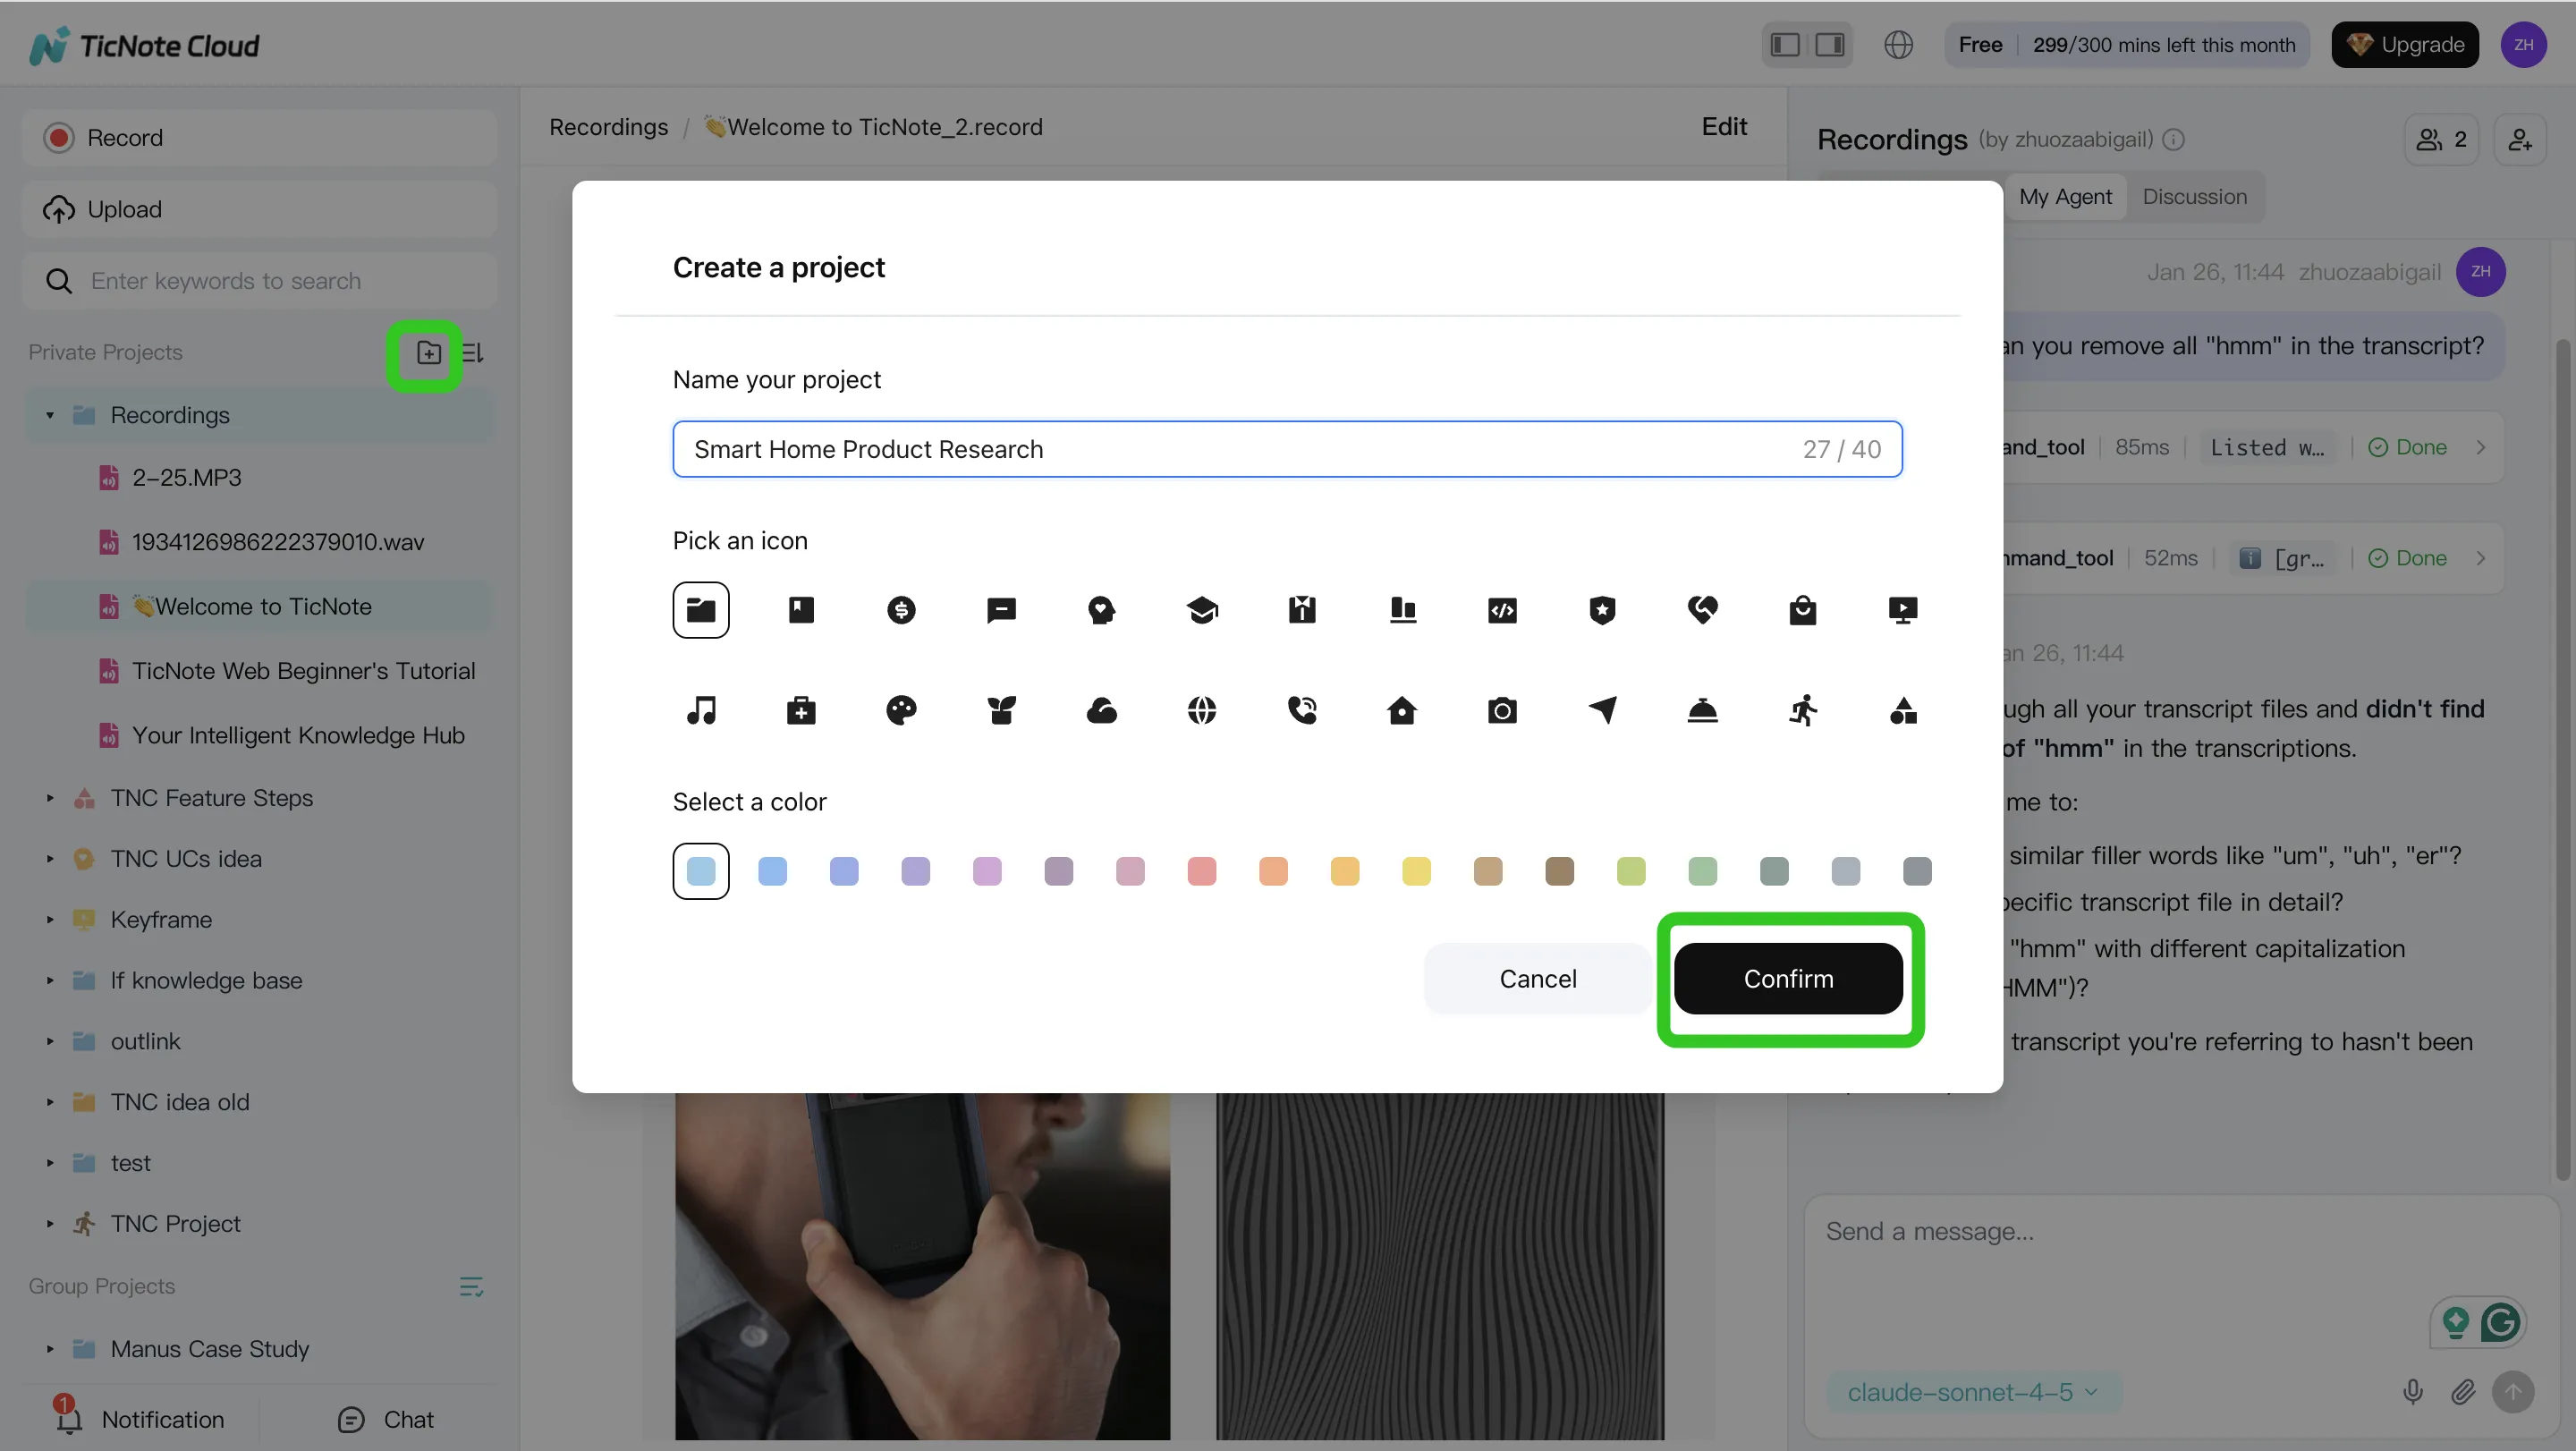
1) Create a project and add content (evidence intake)
Start by picking the "container" for your evidence. Most teams use one project per domain (like "Revenue Ops") or one project per incident (like "Q2 conversion drop"). Then add the inputs that usually live in Slack threads and calendars:
- Meeting transcripts (pricing review, pipeline call, incident war room)
- Docs (launch notes, experiment plans, change requests)
- Assumptions and definitions (what "active user" meant in that meeting)
- Decision log (who approved what, and when)
In TicNote Cloud web studio, that looks like creating or opening a Project, then uploading files or recording meetings to build a Project knowledge base.
Why it matters: these inputs cut ambiguity. When someone asks, "What changed in pricing last week?", you can point to the exact meeting, owner, and decision, instead of guessing in dashboards.
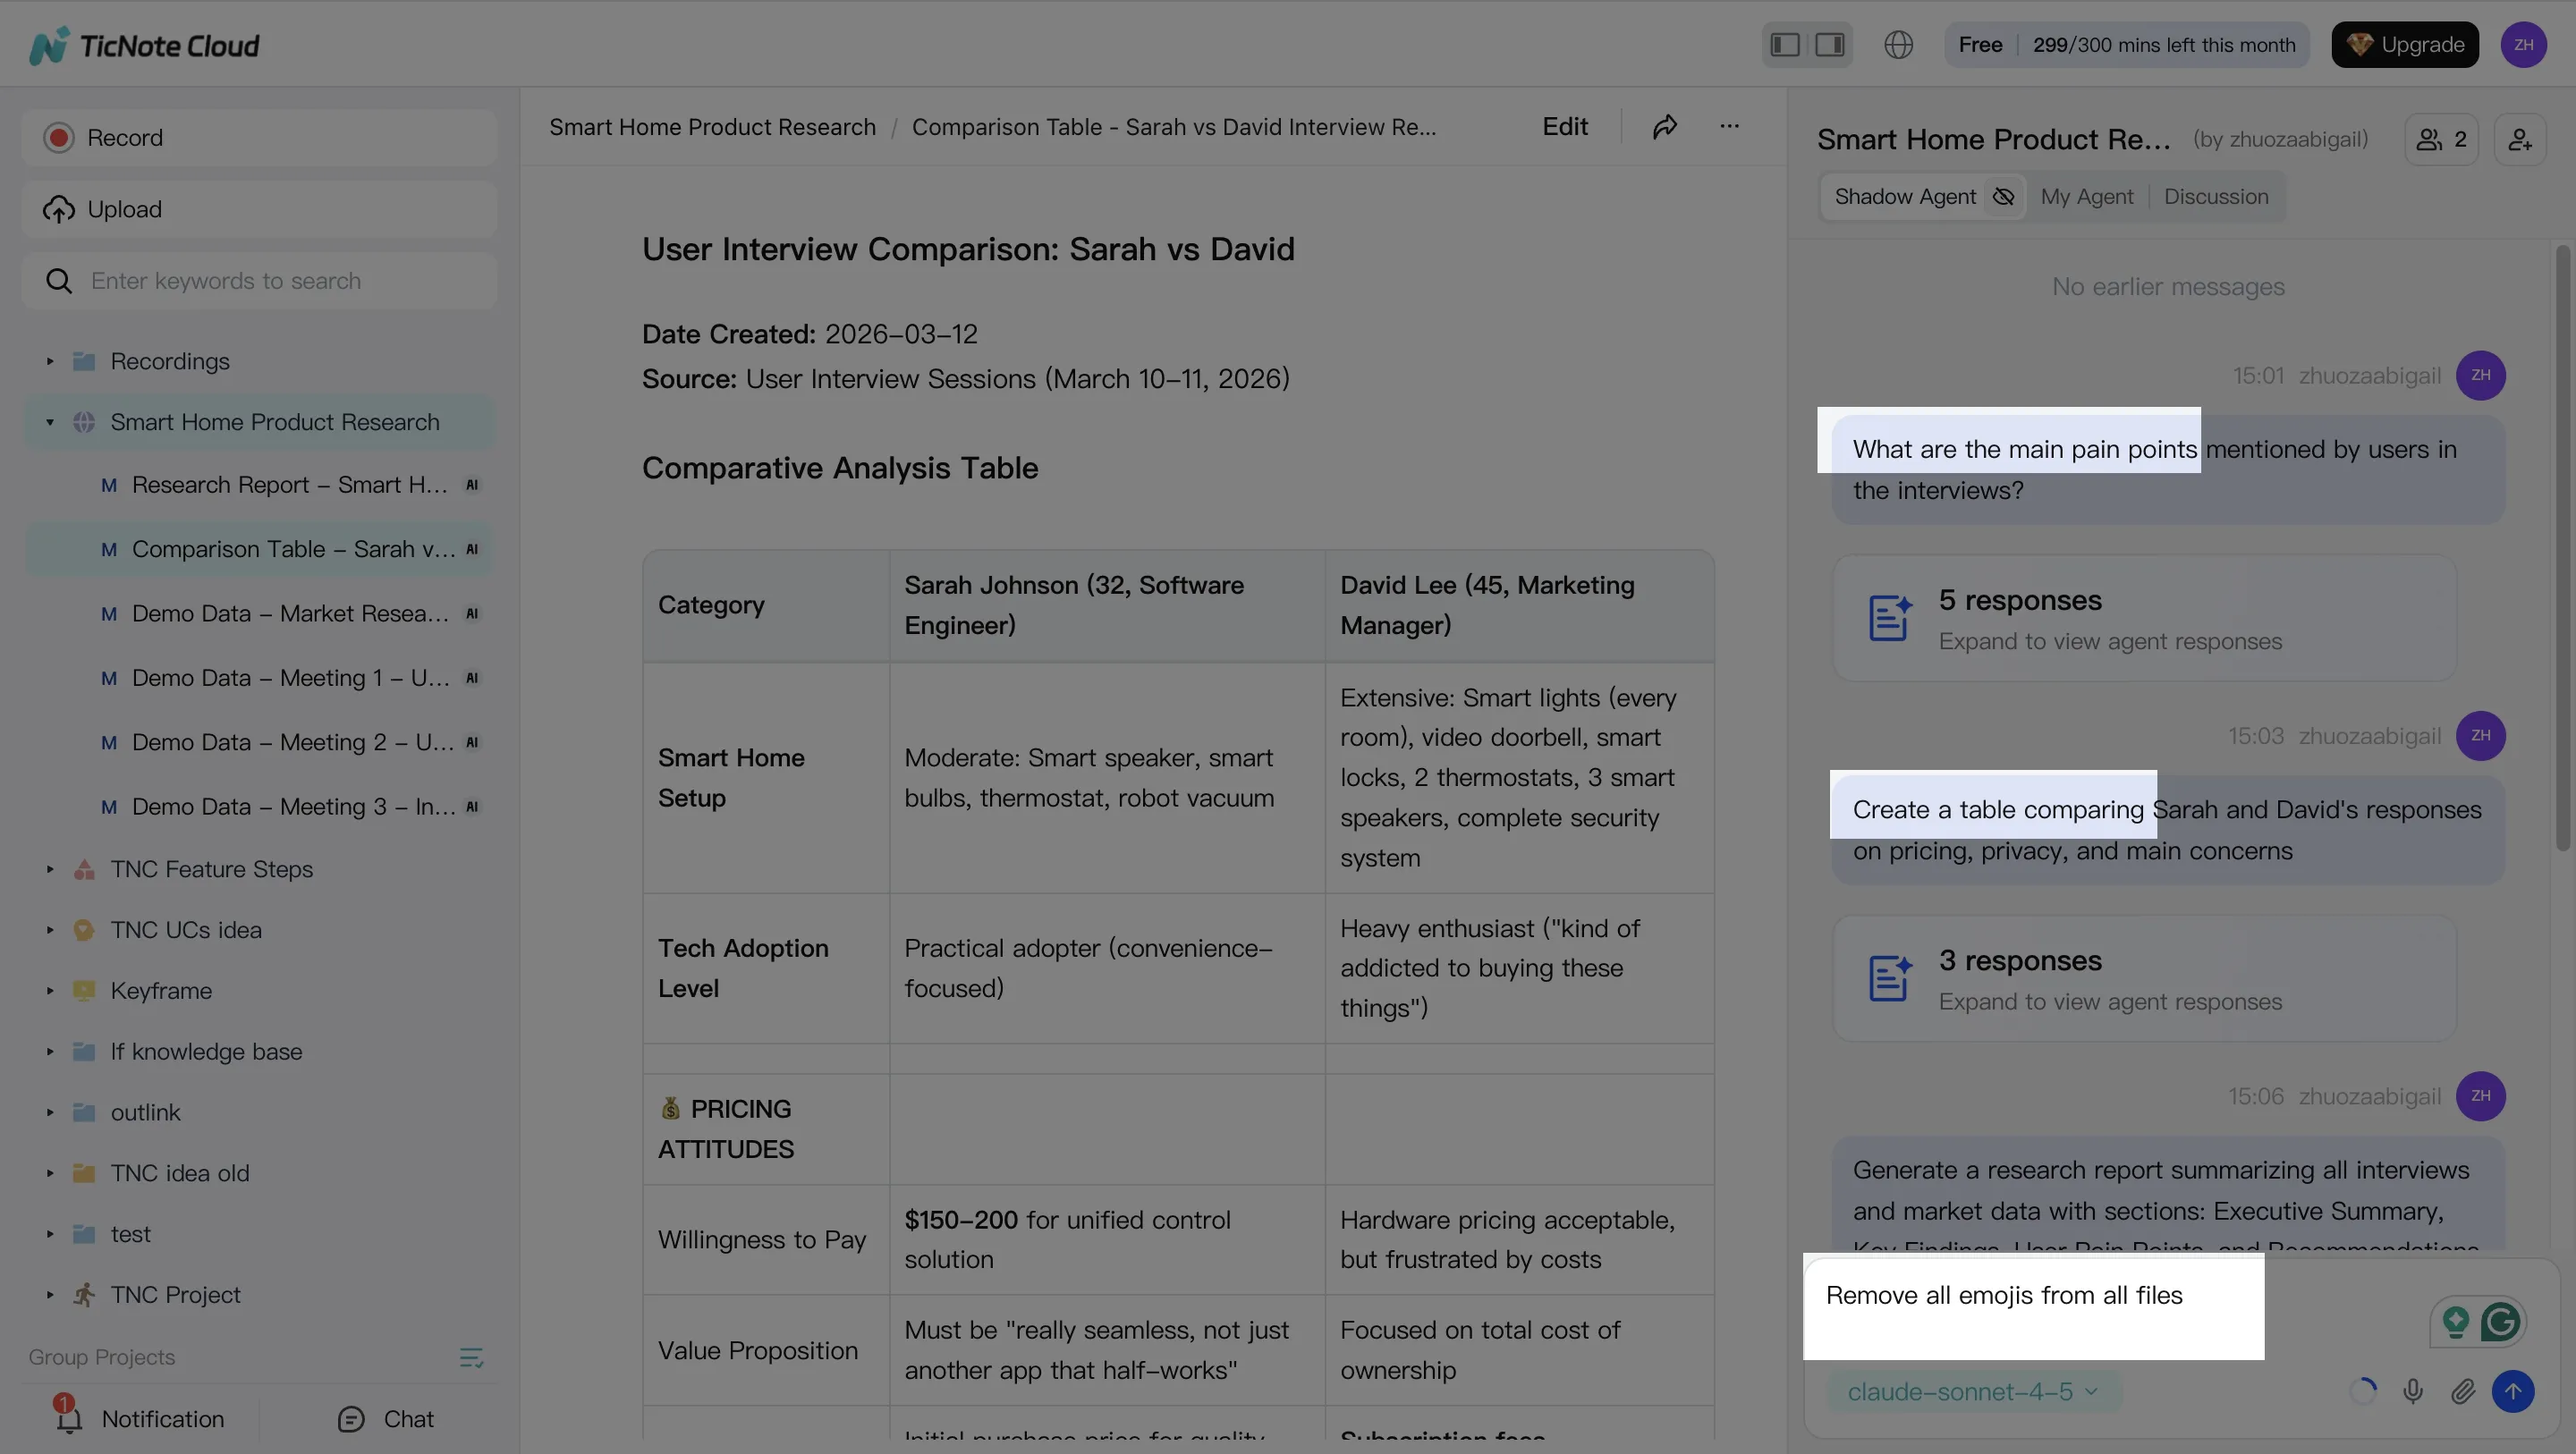
2) Search and analyze with a grounded chat layer (RAG-like behavior)
Next, use a grounded chat layer (RAG-like means it answers using your saved sources). The goal is not "smart answers." The goal is an evidence trail you can trust.
In TicNote Cloud, Shadow AI lives on the right side. Ask it for the decision trail, owners, dates, and any referenced docs. Then have it extract structured facts you can test in data:
- Hypotheses to validate (pricing plan change reduced trials)
- Metric definitions used in the meeting
- Segments to cut (new vs returning, region, channel)
- Time windows (change shipped Monday 10:00)
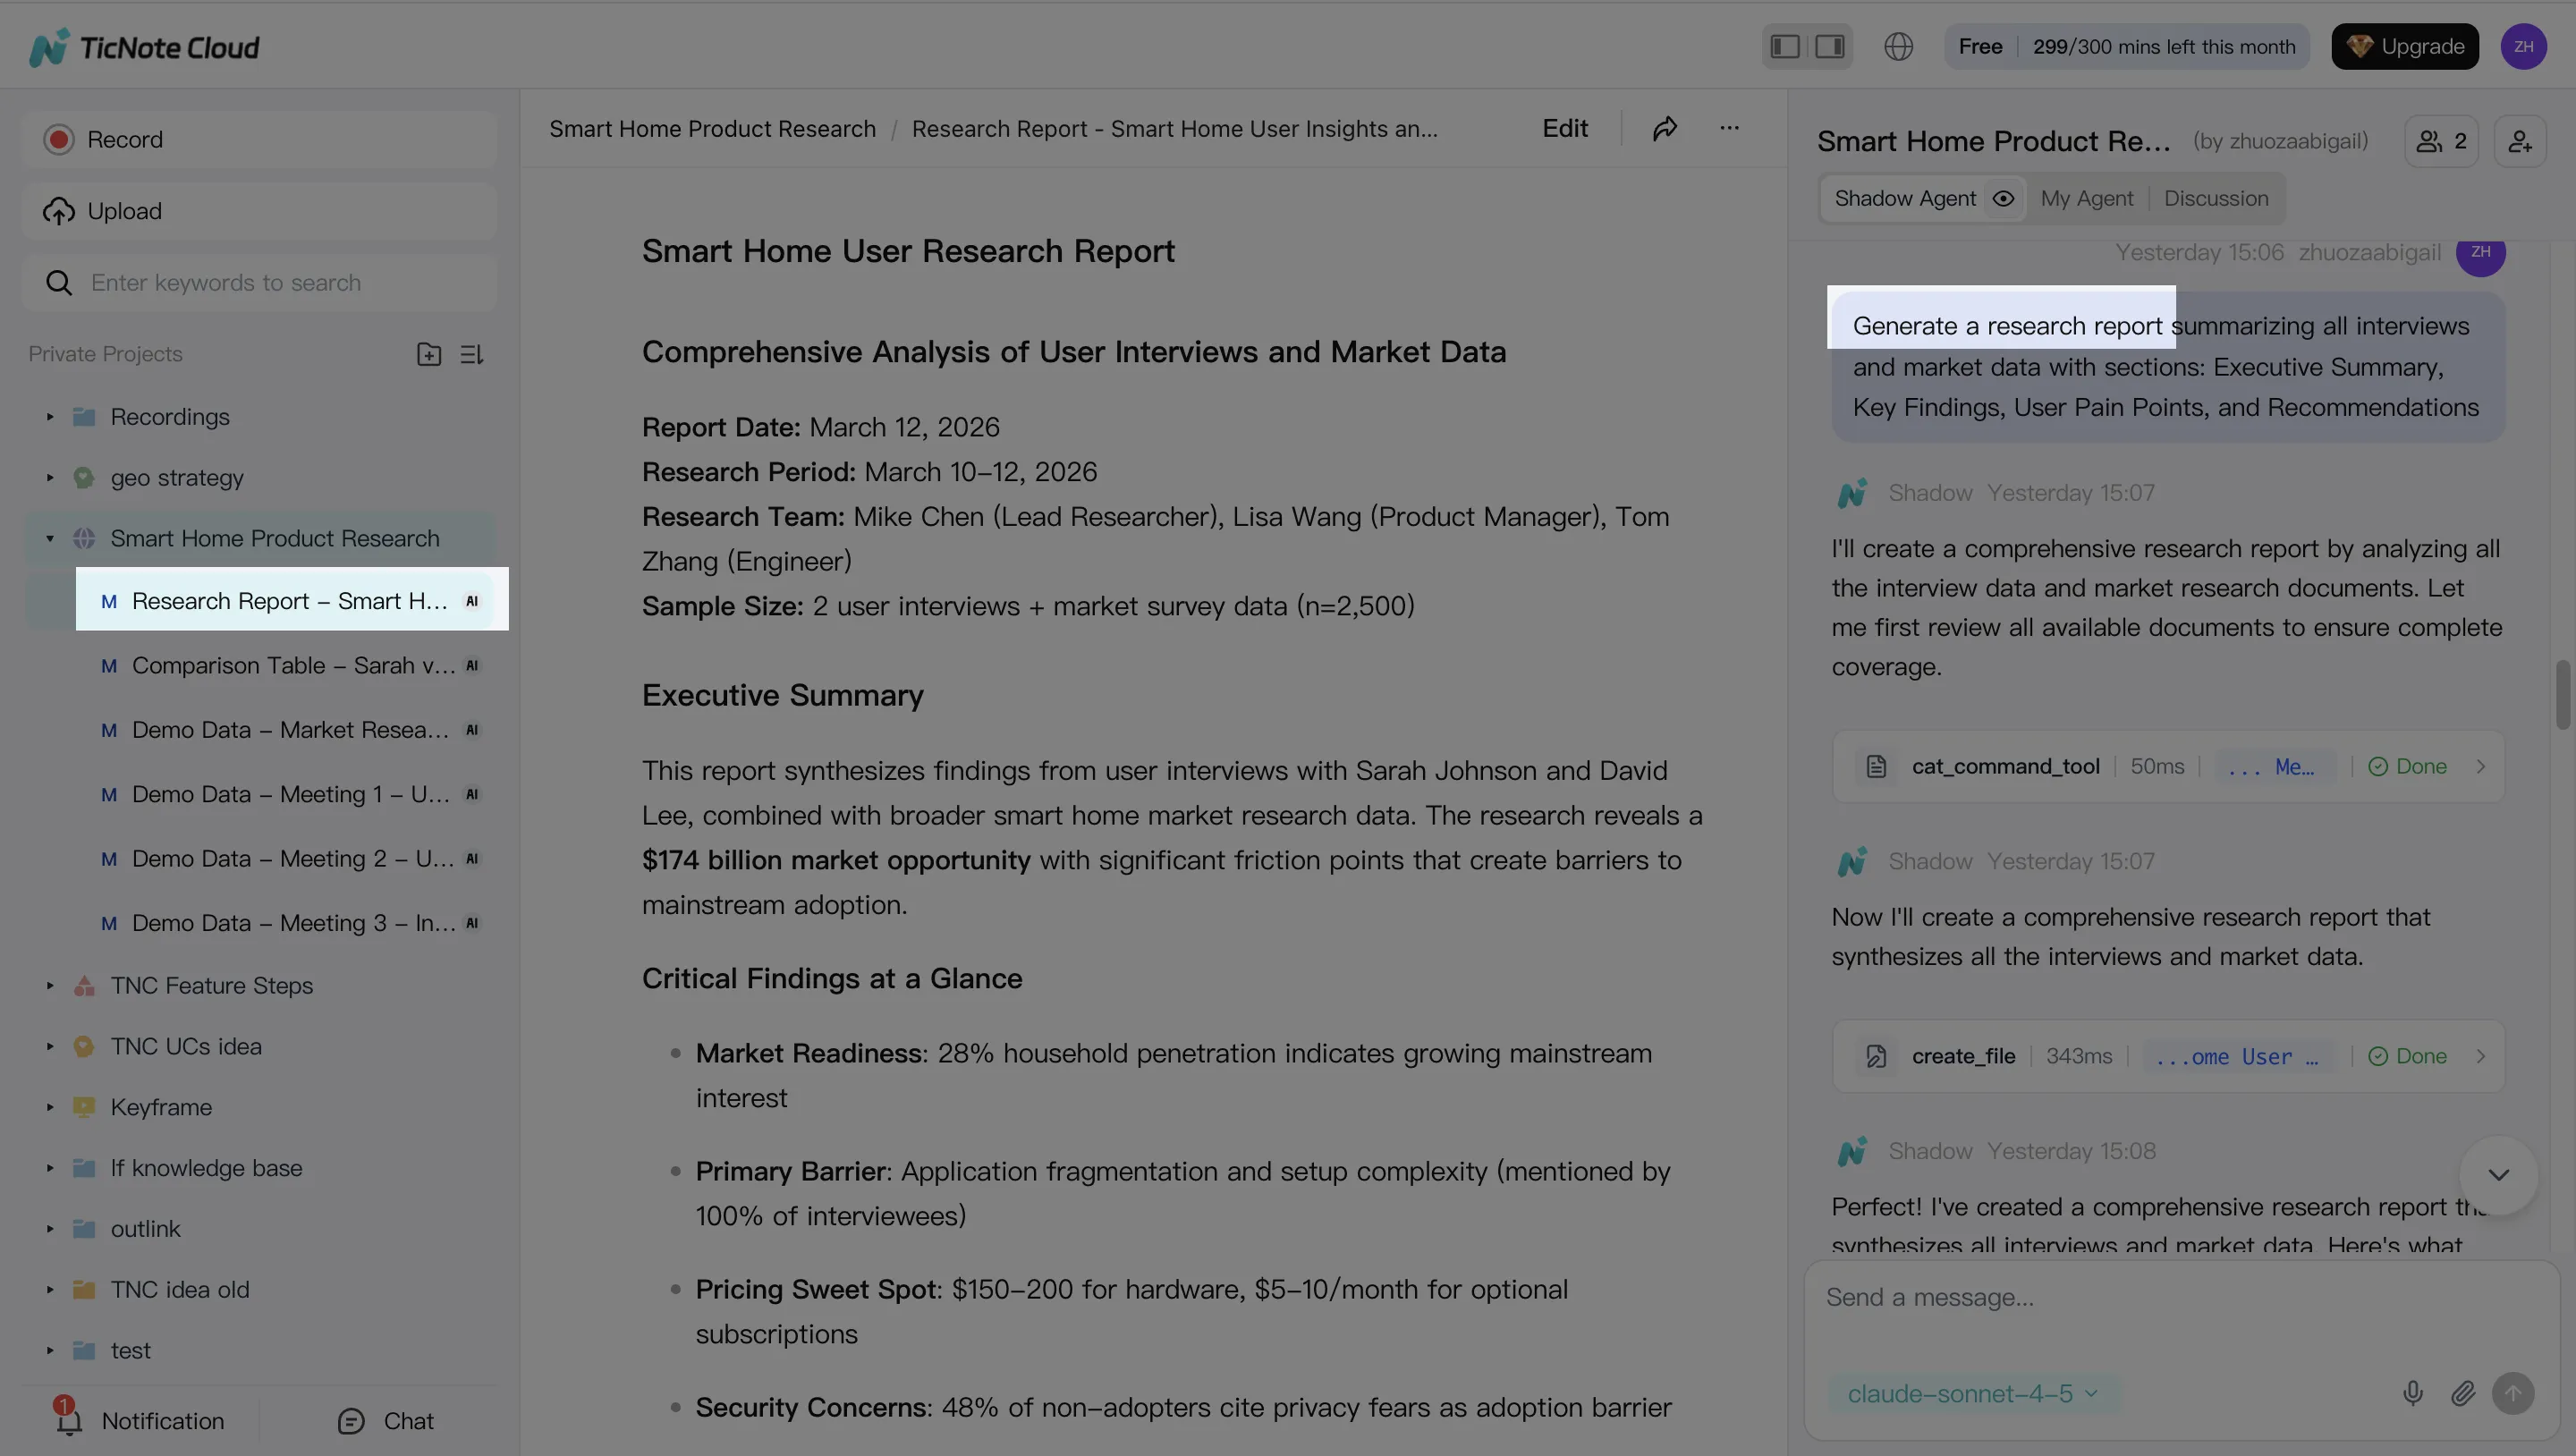
3) Generate deliverables that plug into the analytics workflow
Now turn the evidence into artifacts your analytics workflow can consume. Keep it simple and reusable:
- Investigation brief (question, scope, definitions, hypotheses)
- Stakeholder-ready summary (what we know, what we don't)
- Research-style report (claims plus links back to evidence)
With TicNote Cloud, you can ask Shadow AI to generate these deliverables in the format your team uses, then paste them into a ticket, attach to an RCA doc, or share in Slack.
4) Review, refine, and collaborate with the team
Finally, treat the output like a working doc. Edit it, assign action items, and keep the decision trail auditable.
In TicNote Cloud, you can refine sections with Shadow AI, jump back to the source for verification, and share the Project with role-based permissions so the right people can review.

Governance note: Keep sensitive Projects restricted, and don't copy raw warehouse data into meeting notes. Use the notes to store decisions, definitions, and pointers, then run the real queries in your governed analytics stack.
If you want a simple way to start capturing "what changed" evidence, you can learn what TicNote Cloud is here before you set up your first Project.