

TL;DR — The ROI of Meeting Intelligence in 90 Seconds
meeting intelligence roi comes from cutting recurring meeting waste, speeding decisions, and capturing reusable knowledge. It turns passive recordings into searchable, repeatable outcomes that compound over time.
Biggest levers:
- Time saved: fewer status meetings and faster prep and follow-up.
- Faster decisions: quicker approvals and shorter decision cycles.
- Revenue influence: more pipeline follow-through and less churn.
Validate fast: use an ROI calculator, run a short demo, and test our downloadable template to plug in your numbers. A focused 30 to 90-day pilot on one team usually shows the value and gives clear targets for scaling.
Why meeting intelligence ROI matters now
Organizations run on meetings, and the hidden costs add up fast. Measuring meeting intelligence roi helps leaders turn meeting time into measurable value. According to Gartner Research (2020), a 2019 survey estimates that the cost of ineffective meetings is a staggering $$399 billion in the U.S. and$$58 billion in the U.K., so small gains matter at scale.
Small per-meeting gains scale fast
Every meeting carries repeatable opportunities to save time, reduce follow-up, and speed decisions. Save 15 minutes per meeting and multiply that by ten weekly meetings and 200 people, and you recover thousands of hours yearly. Faster decisions shorten sales cycles and speed product delivery, which you can tie back to measurable revenue impact with simple attribution. Fewer unclear action items reduce rework and missed deadlines, lowering operational cost and raising team throughput.
- Time savings: minutes saved per meeting times meetings per person equals hours recovered. Use that to model labor cost saved.
- Decision velocity: shorter decision lags improve conversion rates and time to market. Track cycle time reduction to show revenue influence.
- Knowledge reuse: searchable transcripts and summaries cut research time and prevent duplicate work.
Measuring meeting analytics roi matters now because work is more distributed and meetings are more frequent. Tools have matured, so you can capture transcripts, summaries, and decisions without heavy setup. At the same time, procurement and security teams want clear, quantifiable returns before wider rollouts. That means pilot with clear metrics: time saved, decision speed, and revenue influence.
Measuring these outcomes turns meeting data into a business case. In the next sections, we give formulas, templates, and a pilot playbook to prove value and scale fast.
Which metrics actually prove ROI (and simple formulas)
Start with the signal that ties meetings to dollars: how much time, decisions, and revenue a meeting changes. Use meeting intelligence ROI to turn raw transcripts and meeting analytics into dollar values. Below are the practical metrics and copy-paste formulas you can drop into an ROI calculator.
Key metrics and copy-paste formulas
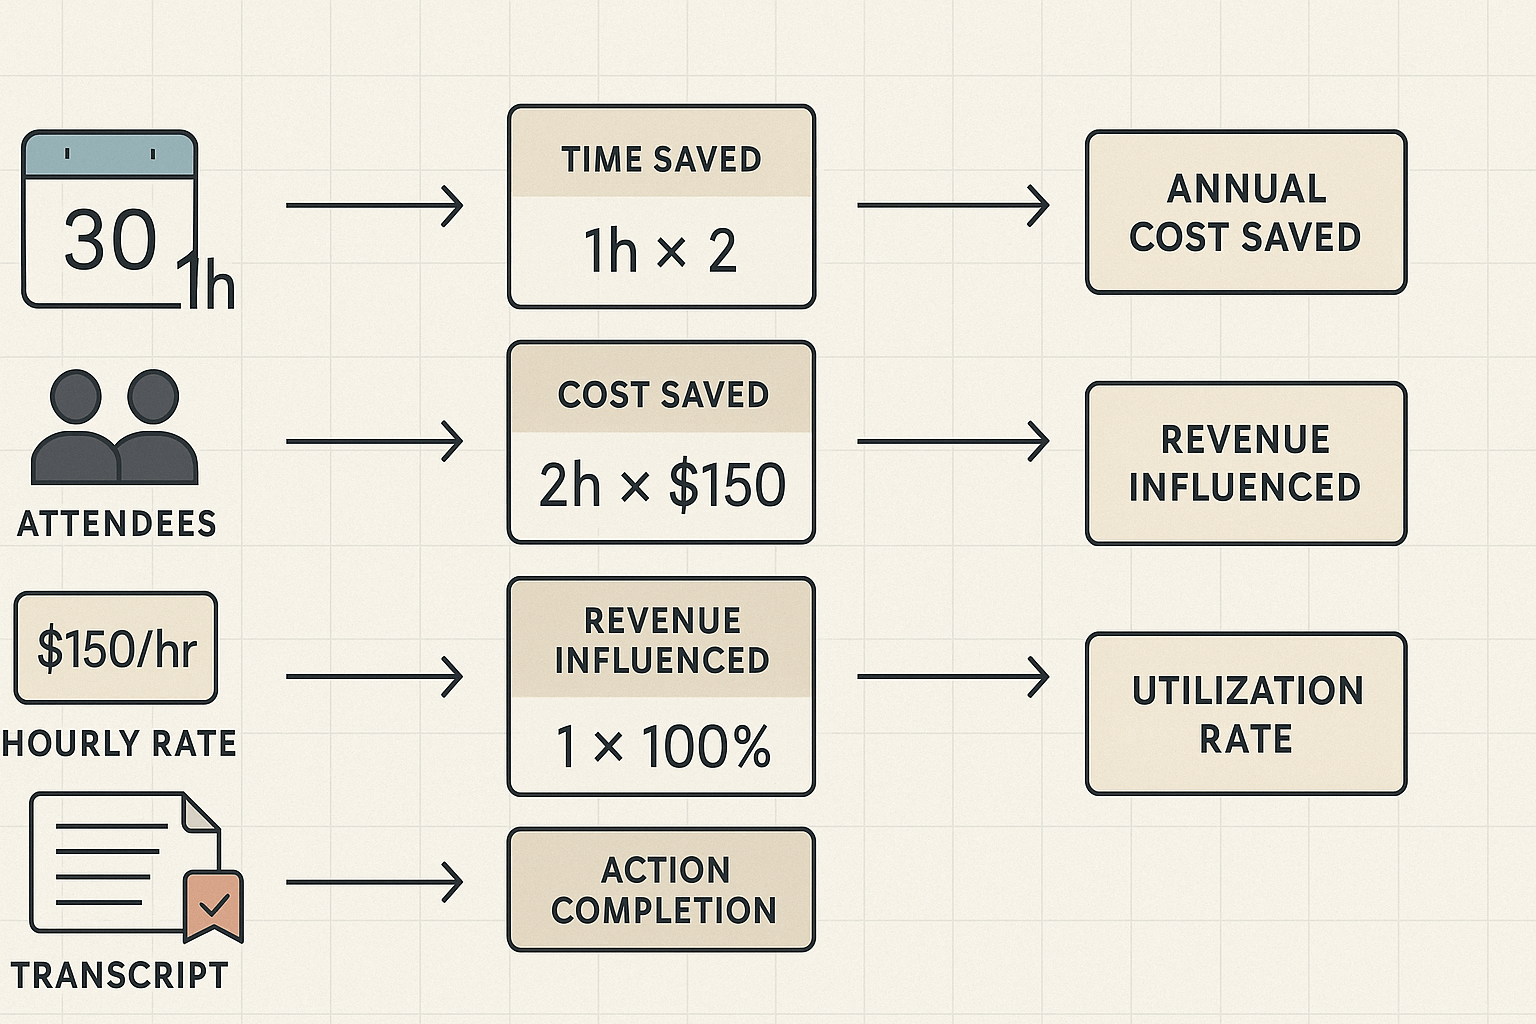
Time saved per meeting (cost impact)
- Time saved per attendee (minutes) = Baseline meeting length - New meeting length
- Cost saved per meeting = (Time saved per attendee / 60) * Average hourly rate * Number of attendees
- Annual savings = Cost saved per meeting * Meetings per week * 52
Decision velocity (speed of decisions)
- Decision velocity improvement (%) = (Baseline time to decision - New time to decision) / Baseline time to decision
- Value of faster decisions = (Average deal value influenced * Deals influenced per period * Win rate uplift) * (Decision velocity improvement)
Revenue influenced per meeting
- Revenue influenced per meeting = Sum(Deal size_i * Probability uplift_i) / Meetings that touched those deals
- Annual revenue influence = Revenue influenced per meeting * Number of influencing meetings per year
Opportunity cost and task leakage
- Opportunity cost per period = Number of missed actions * Average value per action
- Action completion rate = Completed actions / Assigned actions
- Cost of action leakage = (1 - Action completion rate) * Opportunity cost per period
Utilization and productivity
- Meeting utilization rate = Productive minutes (action/decision time) / Total meeting minutes
- Effective work hours reclaimed per week = (Time saved per meeting / 60) * Meetings per week * Number of regular attendees
Engagement and quality measures
- NPS change = New NPS - Baseline NPS (use short post-meeting survey)
- Quality-adjusted value = (Action completion rate * Average value per action) + (NPS change * value multiplier)
Where to pull the inputs
- Meeting length and attendee count: calendar metadata or recording logs.
- Baseline and post-pilot lengths: compare average transcript durations from before and after the tool.
- Average hourly rate: payroll, finance, or use a conservative benchmark. Use role-weighted averages for mixed teams.
- Deals and revenue influence: CRM fields for deal size and stage, then map meetings that referenced those deals via transcript keyword matching.
- Actions and completion: parse transcripts for action-item tags, or use task tracker exports to count assigned vs completed items.
- Engagement metrics: short post-meeting surveys for NPS or sentiment scoring from transcripts.
Use these formulas as copy-paste cells in your Excel or Google Sheet ROI calculator. Start with conservative inputs, then run upside-down and downside scenarios to show a range of outcomes.
If you want reliable meeting intelligence ROI, avoid easy traps that break your maths. Start with a clear baseline and clean data. Without that, gains from automation look larger or smaller than they really are, and leaders distrust the numbers.
Wrong attribution and a shaky baseline
Teams often credit a tool for gains that come from other changes. Fix it: pick a short pilot, run an A/B or phased rollout, and record a clear baseline for key metrics like time spent in meetings, action completion rates, and search time. Use simple formulas and date-stamped snapshots, so you can attribute change to the tool.
Governance checkpoint: require a documented pilot plan and an agreed baseline metric before any ROI claim.
Noisy or low-quality data
Bad transcripts, missing tags, or inconsistent templates make analysis useless. Mitigate by enforcing standardized templates, running regular quality audits, and using confidence scores to flag low-quality transcripts. Train participants on recording best practices and set automated alerts for low-confidence files.
Governance checkpoint: include a monthly data-quality review in your analytics routine.
Overlapping tools and feature redundancy
If multiple tools capture meetings, you’ll double-count time savings or lost actions. Map your stack: list each tool, its outputs, and the owner. Consolidate or assign a single-source truth for transcripts and actions, and log which tool produced each metric.
Governance checkpoint: publish a tool map and a single owner for meeting records and ROI reporting.
Privacy and compliance blind spots
Recording and analyzing meetings raises legal risks if you skip consent and retention rules. For example, European Data Protection Board (2025) notes that under the GDPR, consent must be freely given, informed, specific, and unambiguous. Fix this by adding consent prompts, role-based access, and short default retention windows.
Governance checkpoint: require legal sign-off on consent language and a published retention policy.
Keep the measurement plan tight and repeatable. Small upfront controls stop noisy claims later, and they make your meeting intelligence ROI believable and defensible.
How TicNote Cloud’s modules map to ROI (role-based)
Start by matching tools to outcomes. This section maps TicNote Cloud modules to clear ROI levers so leaders can link features to CFO-friendly KPIs like time saved, deal velocity, and compliance risk reduction. If you want to prove meeting intelligence ROI, here are role-focused uses, quick wins, and the metrics to track.
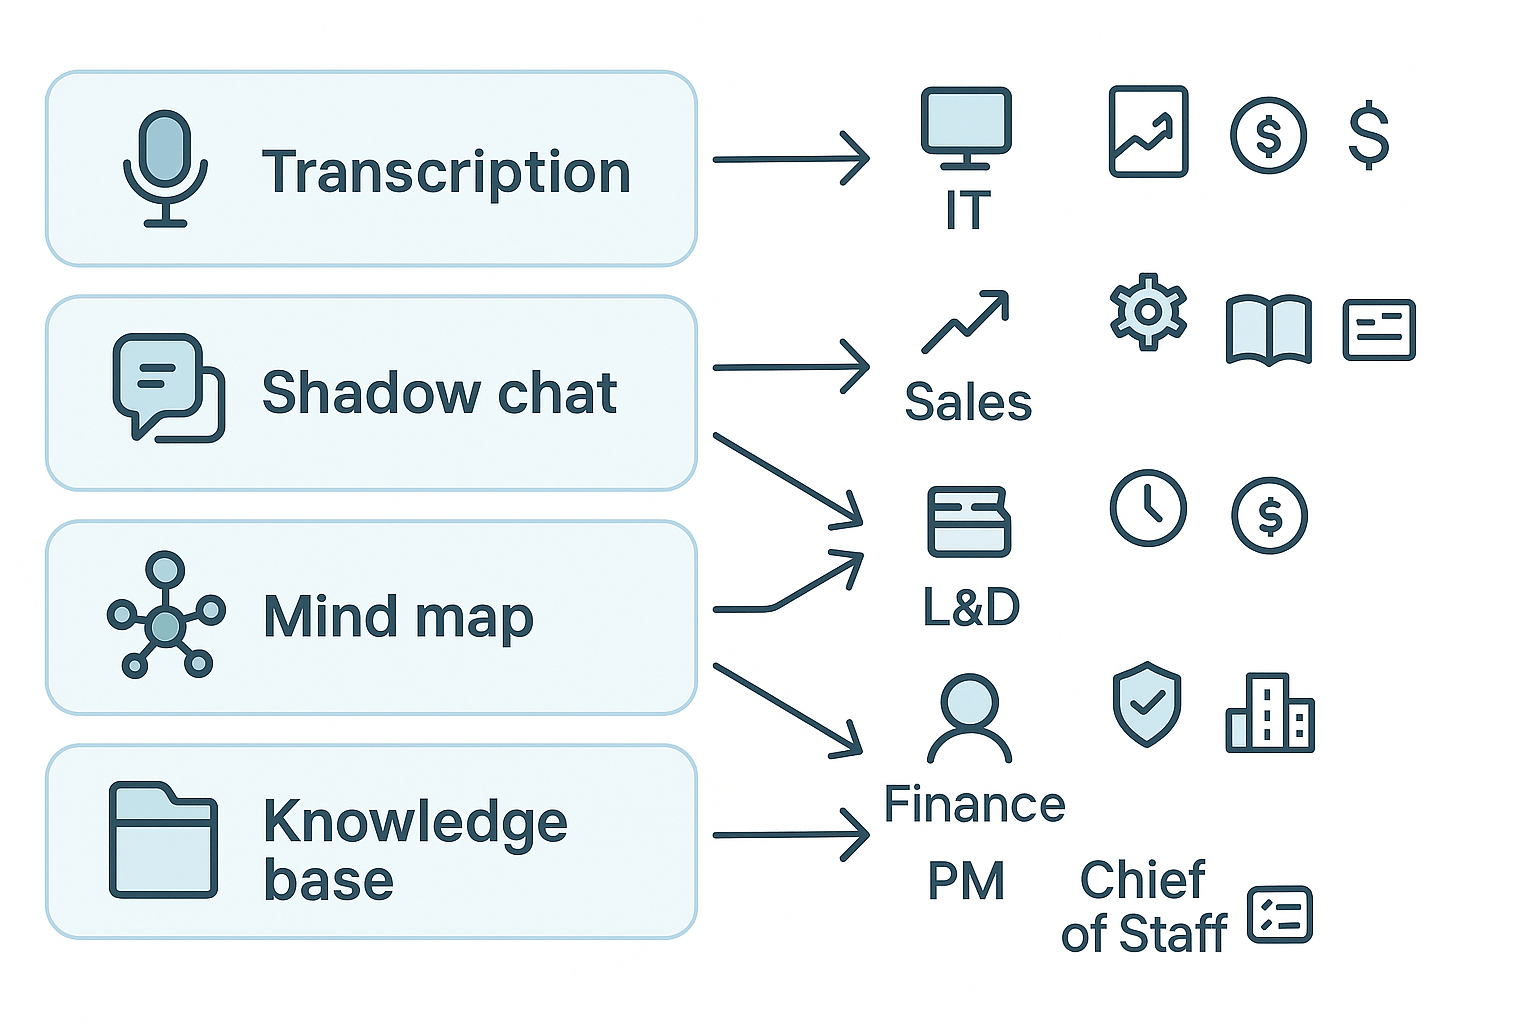
Core modules and what they drive:
- Transcription: Faster note capture, searchable transcripts, audit trails.
- Shadow chat (contextual AI): Fast answers across meetings and files, deal prep, and risk checks.
- Mind map: Visual reviews that cut review time and speed decisions.
- Knowledge base: Reuse past decisions, faster onboarding, fewer repeated questions.
IT: secure deployment and lower tooling overhead
- Use case: Centralizing capture without new recording bots.
- Quick wins: Fewer point tools supported, faster provisioning, clearer retention.
- Metrics: Total tools retired, admin hours saved, time to onboard.
Sales: increase deal velocity and win rate
- Use case: Speeding up follow-up and discovery.
- Quick wins: Faster proposals, fewer missed actions, better call handoffs.
- Metrics: Days to close, follow-up time, pipeline conversion rate.
Ops: standardize decisions and reduce rework
- Use case: Central notes and templates for a consistent process.
- Quick wins: Fewer duplicates, shorter process cycles.
- Metrics: Task rework rate, cycle time, and action closure time.
L&D: scale learning and reduce training time
- Use case: Turning sessions into searchable assets.
- Quick wins: Faster content creation, targeted refreshers.
- Metrics: Time to competency, content reuse, training hours per hire.
Finance: quantify savings and risk control
- Use case: Audit trails and lower meeting costs.
- Quick wins: Fewer disputes, clearer logs.
- Metrics: Cost per meeting, budget variance, ROI from saved hours.
Product Managers and Chiefs of Staff: faster decision cycles
- Use case: Capturing decisions and cross-team context.
- Quick wins: Fewer status calls, clearer roadmaps.
- Metrics: Decision-to-action time, meetings canceled, decision ownership rate.
Enterprise buyers: policy, scale, and compliance
- Use case: SSO, governance, enterprise reporting.
- Quick wins: Standardized policy, complete records.
- Metrics: Time to compliance review, meetings logged, and reuse rate of decisions.
Mini case studies + worked ROI calculations (downloadable templates)
These two quick before and after case studies show how to turn meeting data into dollar value. They use real inputs you can paste into the downloadable Excel or Google Sheet ROI template. Each case lists the inputs, the step by step math, and a ready-to-copy formula so you can validate results against the demo clips in the resource panel. The phrase meeting intelligence roi is used here to keep search context clear.
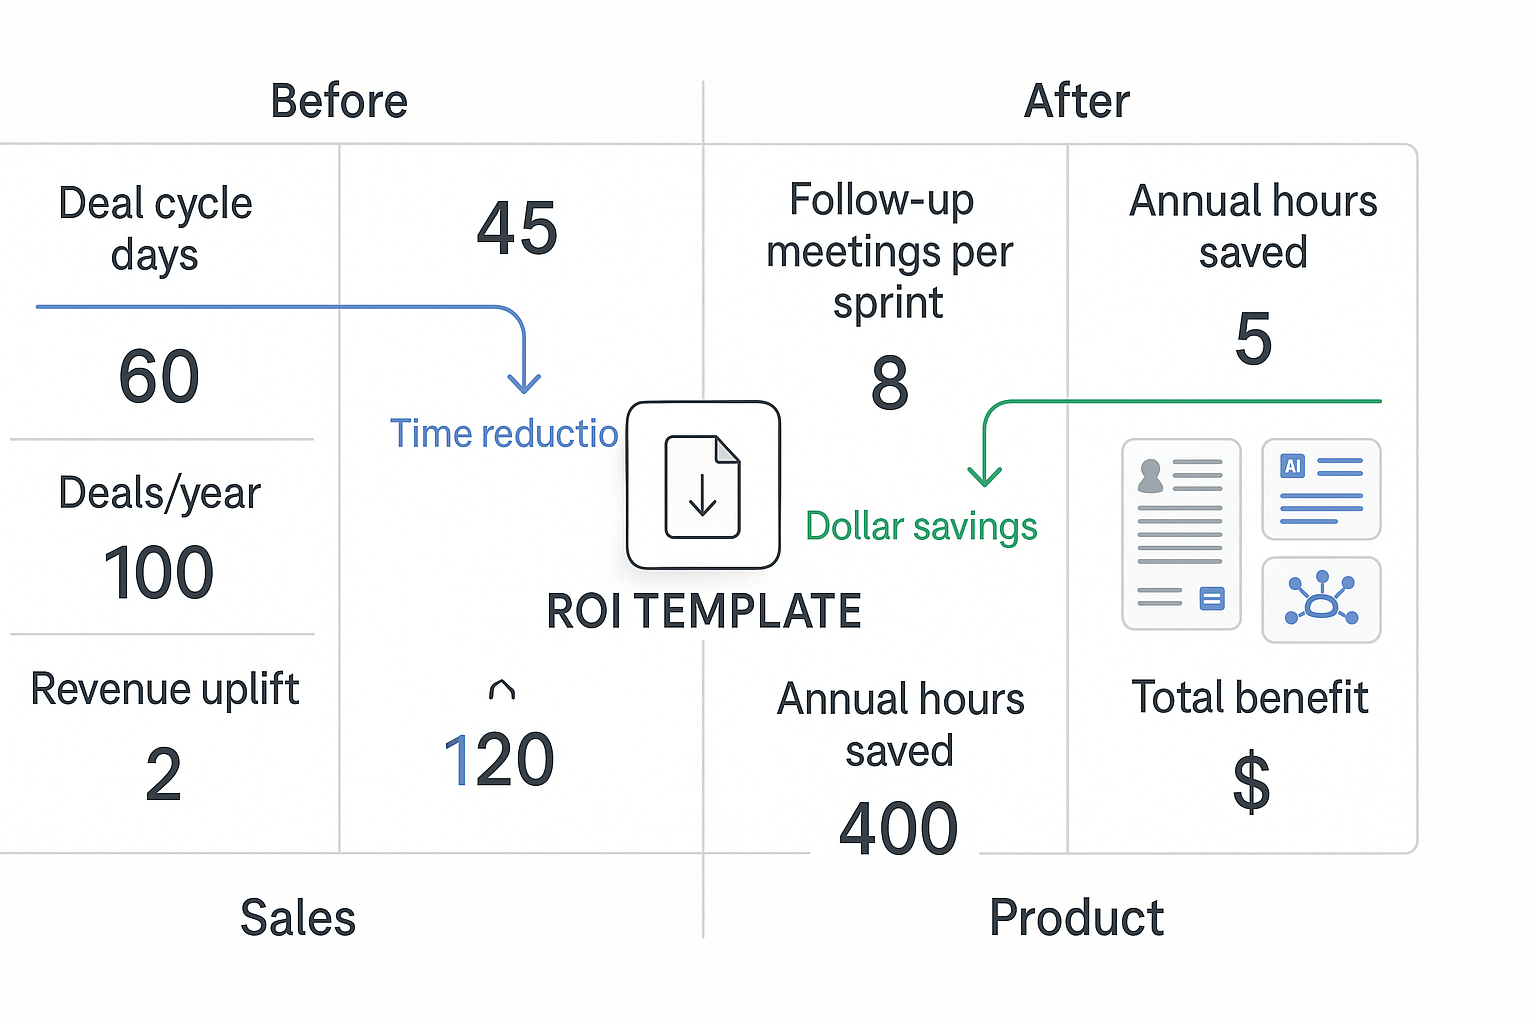
Sales team: cut deal cycle, close more
Problem: Sales reps spent hours on follow-ups and manual note hunting. Deals took 90 days on average. After adopting meeting intelligence, cycle length fell to 60 days and handoff friction dropped.
Key inputs to paste into the template:
- AvgDealValue = $50,000
- Reps = 8
- WinRate = 0.25 (25%)
- OldCycleDays = 90
- NewCycleDays = 60
Step-by-step calculation (plain math)
- Old deals per rep per year = 365 / OldCycleDays
- New deals per rep per year = 365 / NewCycleDays
- Additional closed deals per year = (New - Old) * Reps * WinRate
- Annual revenue uplift = Additional closed deals per year * AvgDealValue
Ready-to-copy Excel formulas (assume cells A2:A6 contain the inputs in the order above):
- =365/A4
- =365/A5
- =((365/A5)-(365/A4))A3A2
- =(((365/A5)-(365/A4))A3A2)*A1
Worked example with numbers
- Old deals per rep = 365/90 = 4.06
- New deals per rep = 365/60 = 6.08
- Additional deals = (6.08-4.06)80.25 = 4.04 deals
- Revenue uplift = 4.04 * $$50,000 =$$202,000 per year
Product team: fewer follow-ups, faster releases
Problem: Product managers and engineers ran many clarifying meetings. Releases slipped. Using meeting summaries, searchable decisions, and auto action items cut follow-up meetings per sprint from 6 to 2.
Key inputs:
- TeamSize = 10 (PMs + Eng)
- AvgHourlyCost = $75
- FollowUpsPerSprintOld = 6
- FollowUpsPerSprintNew = 2
- AvgFollowUpLengthHours = 1.0
- SprintsPerYear = 24
- DaysReleaseSaved = 5
- DailyRevenueImpact = $8,000
Step-by-step calculation
- Meeting hours saved per sprint = (Old - New) * AvgFollowUpLengthHours
- Annual hours saved = Meeting hours saved per sprint * SprintsPerYear * TeamSize
- Annual meeting cost saved = Annual hours saved * AvgHourlyCost
- Revenue uplift from faster releases = DaysReleaseSaved * DailyRevenueImpact
- Total annual benefit = Annual meeting cost saved + Revenue uplift
Excel formulas (assume cells B1:B8 hold inputs in the order above):
- =(B3-B4)*B5
- =((B3-B4)*B5)B2B6
- =(((B3-B4)*B5)B2B6)*B1
- =B7*B8
- =((((B3-B4)*B5)B2B6)B1) + (B7B8)
Worked example numbers
- Hours saved per sprint = (6-2)*1 = 4 hours
- Annual hours saved = 4 * 24 * 10 = 960 hours
- Annual meeting cost saved = 960 * $$75 =$$72,000
- Revenue uplift = 5 * $$8,000 =$$40,000
- Total annual benefit = $112,000
How to validate and reuse
- Copy the inputs into the downloadable Excel/Google Sheet ROI template. The template has named cells and the formulas above prefilled.
- Swap in your team numbers to see personalized results.
- Use the short demo clips in the article resource panel to match the before and after meeting workflows and confirm the time-savings assumptions.
The two worked examples map cleanly to the ROI template tabs: Sales Velocity and Product Efficiency. Use them as a baseline, then adjust conservative and optimistic scenarios in the sheet to stress test assumptions.
Implementation checklist: from pilot to scale (incl. privacy & governance)
Start small, measure fast, and build for scale. This playbook shows how to run a meeting intelligence roi pilot that proves value and keeps data safe. It covers pilot design, clear success criteria, how to instrument meetings, and a rollout checklist for consent, data governance, and training.
Design the pilot
- Define scope and users: pick 2 to 3 teams with meeting-heavy workflows. Keep pilot size manageable, 10 to 30 recurring meetings.
- Set duration and windows: run a 6 to 8 week pilot with a 2 week baseline period. Collect baseline metrics before enabling recording or notes.
- Assign roles: executive sponsor, product owner, IT security lead, and 2 frontline champions.
Instrument meetings and measure
- Capture transcripts and timestamps for each meeting. Tag topics, decisions, and action items in the transcript.
- Link meetings to CRM or project IDs so outcomes tie to revenue or delivery.
- Track follow up completion in a shared board to measure downstream impact.
- Use consistent templates for notes and summaries to compare results across teams.
Pilot success thresholds
- Adoption: 60 to 80 percent of invited users actively use the tool.
- Efficiency: 15 to 25 percent reduction in time spent in or on meetings (prep + follow up).
- Outcomes: 20 percent faster task completion or response time for tagged actions.
- Qualitative: improved meeting clarity in post-pilot surveys from users and stakeholders.
Rollout and governance checklist
- Obtain documented consent from participants.
- Complete a data protection impact assessment (DPIA) if required.
- Define retention and deletion policies.
- Set access roles, SSO, and audit logging.
- Verify encryption in transit and at rest.
- Update vendor contract for data handling and compliance.
Change management, quick wins
- Secure an exec sponsor and internal champions.
- Run short training sessions and office hours.
- Share measurable early wins and templates.
- Iterate, then scale by expanding teams and adding automations.
Visual assets to include: screenshots, ROI calculator, diagrams
Start with a tight set of visuals that answer readers’ first questions: what the tool does, how ROI is measured, and how to run a pilot. Include a live demo video, an interactive ROI calculator, a clear workflow diagram, and a downloadable pilot checklist. These assets make meeting intelligence roi tangible and give readers tools to act immediately.
Core assets to embed
- Lightweight demo video: 60–90 seconds, MP4. Show key flows such as recording to summary, mind map generation, and Shadow chat. Place it near the article top so readers see product value fast.
- Interactive ROI calculator: Google Sheets or Excel with a web embed. Include inputs for meeting volume, average hourly rate, and capture rate, then show time saved and dollar ROI. Offer a downloadable copy behind a simple email capture.
- Workflow diagrams: SVG or PNG, two variants: a high-level 3-step flow and a detailed 6-step pilot flow. Put the simple flow beside the calculator and the detailed flow in the implementation section.
- Downloadable pilot checklist PDF: 1–2 pages, privacy and governance notes included. Gate this behind a light email form and link it from the case studies and implementation checklist.
Formats, captions, and accessibility
Caption every asset with a one-line benefit statement. Provide alt text for images and transcripts for videos. Use responsive embeds so the ROI sheet and video display on mobile. That raises conversion and keeps compliance teams happy.
Measuring long-term impact & advanced analytics
Start by treating meeting intelligence as an input into longer-term business signals, not just a short-term cost saver. Meeting intelligence roi becomes clear when you track cohorts, trends, and how meeting signals later show up in CRM and revenue. Over time, that institutional memory lowers repeat work, speeds onboarding, and raises customer responsiveness.
Track cohorts and trends
Measure groups of users or teams over time. Start with a baseline month, then follow cohorts by hire date, product team, or customer segment. Key cohort metrics include action item completion rate, meeting prep time, rework episodes (repeat questions), and time to first value for new hires. Use simple trend charts to spot decay or improvement, and run quarterly comparisons to show sustained gains.
Link meeting signals to CRM outcomes and revenue
Capture meeting-derived signals: decisions, next steps, stakeholder sentiment, and follow-up promises. Map those signals to CRM events like opportunity creation, pipeline movement, and closed deals. For support and success teams, measure case deflection and renewal rate uplift. As one study notes, [Forrester B2B Summit North America: New Research Unveiled (2024)] Customer-obsessed companies grow revenue 28% faster and have 33% higher profitability growth and 43% better customer retention rates compared to non-customer-obsessed companies.
Use these analytics models to show sustained ROI:
- Simple attribution: count converted deals with meeting-derived next steps.
- Time-lag regression: correlate meeting signal volume with revenue after a lag.
- Cohort uplift analysis: compare matched cohorts with and without meeting intelligence.
- Knowledge decay model: measure how often information must be repeated, then track reduction.
Cross-meeting Q&A and Shadow searches build searchable memory. That reduces repeated work, shortens ramp time, and protects tribal knowledge. Pair these signals with CRM events each quarter to convert operational wins into revenue stories and executive-level ROI that lasts.