
TL;DR: Quick answers: What to track and why it matters
Track five key meeting metrics to cut wasted time and lift outcomes: meeting frequency and recurring count; time spent in meetings (total and per person); attendance and participation rate; action item completion and decision capture; and meeting effectiveness and sentiment. These meeting metrics reveal where meetings drain hours, who’s overloaded, which sessions drive decisions, and whether follow-ups actually happen. Track them for 4 to 12 weeks to spot patterns and quick wins.
Included with this guide are a downloadable KPI CSV template and a ready-to-run post-meeting survey. Use the CSV to build a simple dashboard and the survey to measure clarity and sentiment week to week. The practical outcome is simple: fewer unnecessary meetings, clearer decisions, and higher task completion across your team.
Why measure meetings? The costs, benefits, and blind spots
Unstructured meetings quietly eat time and attention. Meeting metrics give managers a clear way to stop that waste and drive better decisions. Good metrics show where meetings help and where they hurt productivity.
Real costs: time, attention, and slow execution
Managers and teams spend hours in meetings that add no clear output. That time reduces deep work and increases context switching. When decisions live only in conversation, work stalls and errors grow.
Big benefits of a metric-driven program
A few reliable measures reveal what to keep, shrink, or stop. Metrics cut meeting load, speed follow-up, and make roles and decisions visible. They also built a repeatable feedback loop for meeting design.
Common blind spots to watch
- Recurring meetings that exist by habit, not need.
- No clear decision capture, so outcomes vanish.
- Action items are assigned verbally and never tracked.
- Unequal participation and hidden bottlenecks.
Start simple: five core metrics capture most value. They help you find recurring meetings that do not need to exist, surface missing decisions, and stop lost action items.
Why measure meetings? The costs, benefits, and blind spots
Meetings eat time and momentum when they’re unstructured. Tracking a small set of meeting metrics gives managers a clear, fast way to cut waste and raise outcomes. With a few numbers, you can spot meetings that should be shorter, combine redundant sessions, and protect heads-down work.
According to Stop the Meeting Madness, executives spend an average of nearly 23 hours a week in meetings, up from less than 10 hours in the 1960s. That scale of time loss costs focus, delays decisions, and bloats project timelines.
Where teams usually blindside themselves
- Recurring meetings that don’t need to exist. They run by default, not on value. Review frequency and cancel when the outcome drops.
- Missing decisions and unclear owners. Conversations end without a recorded decision. That forces rework and extra calls.
- Lost action items. Tasks vanish into chat or personal notes. No owner means no follow-through.
Start with a simple metrics set: frequency, time per person, attendance, action completion, and sentiment. These five metrics reveal the biggest leaks fast. Track them weekly. Small measurement work leads to big time savings and clearer outcomes.
Metric 1: Meeting Frequency & Recurring Meeting Count — Measurement and Optimization
Monitoring how often meetings occur and how many are recurring is essential for reducing calendar bloat and increasing team focus time. This section outlines how to measure recurring meetings, identify inefficiencies, and take immediate action.
How to Differentiate Recurring vs Ad Hoc Meetings
- Export calendar data for a 30–90 day range. Include fields: title, organizer, attendees, start/end times, and recurrence.
- Identify recurring meetings using RRULEs or patterns. If RRULE is unavailable, consider 3+ identical events (title, organizer, timing).
- Mark isolated events as ad hoc.
- Use transcript and note patterns to catch renamed recurring meetings (e.g., “Daily Check-in” vs “Morning Sync”). Apply text similarity analysis.
Key Formula
Recurring meetings per team = (Total distinct recurring series) / (Number of teams)- Example: 15 recurring meeting series across 5 teams = 3 recurring meetings per team.
Optimization Benchmarks
- Normal: 3–6 recurring meetings/team
- Red Flag: 8+ recurring meetings/team or multiple daily meetings
Actionable Fixes
- Require agendas 48 hrs ahead or cancel meeting
- Merge redundant recurring invites
- Rotate team representatives for recurring meetings
- Set weekly no-meeting blocks for deep work
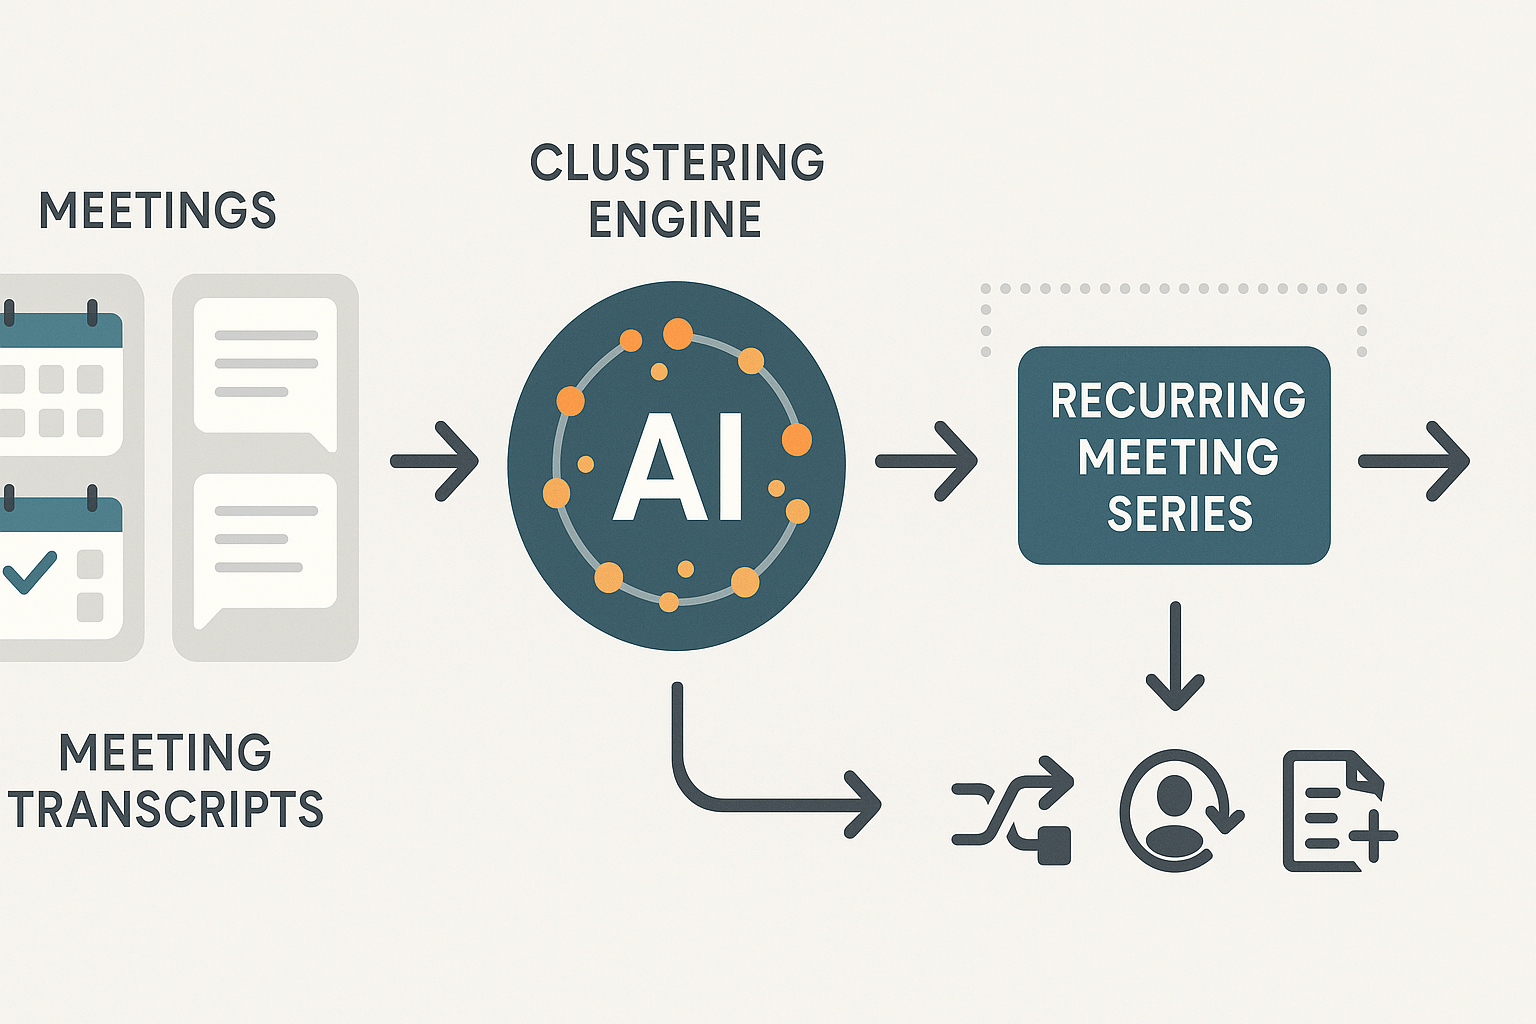
Using TicNote to Automate Detection
Leverage TicNote Cloud and Shadow AI:
- Import calendars and meeting logs
- Run clustering on meeting transcripts to detect repeated themes
- Identify series lacking outcomes
- Generate visual recurring meeting maps with action recommendations
This proactive method ensures energy isn’t drained by ineffective recurring meetings and helps realign meeting culture with team productivity.
Metric 2 — Time spent in meetings (total and per-person): Measurement method & benchmarks
Track total meeting hours to see where time sinks are. Meeting metrics start here: tally weekly meeting-hours for the team, then split by person to find overloads. That view tells you which roles carry most meeting load and where to reclaim time.
How to calculate meeting hours, fast
- Weekly meeting-hours (team): sum of meeting duration in hours across all meetings this week. Formula: Weekly meeting-hours = Σ (meeting_duration_minutes) ÷ 60
- Per-person load: count each attendee’s minutes for the week. Formula: Person meeting-hours = Σ (minutes_attended_by_person) ÷ 60
- Meetings per type: group meetings by tag (status, planning, 1:1) and sum durations to spot costly categories.
Convert hours to business impact: simple productivity-cost model
Estimate impact with an hourly rate and a productivity multiplier. Use your org’s average fully loaded hourly cost.
Formula: Weekly cost = meeting-hours × hourly_rate × productivity_factor
Example: 20 meeting-hours × $$60/hour × 0.7 productive factor =$$840/week in effective work lost. The productivity factor (0–1) captures attention loss from context-switching.
Benchmarks and how to read them
- Low load: under 6 hours/week per person, usually healthy for heads-down work.
- Medium: 6 to 12 hours/week, tolerable but watch recurring meetings.
- High: over 12 hours/week, likely causes delays and burnout.
Use these as starting guards, adjust for senior roles and customer-facing jobs.
Quick tactics to reclaim time
- Cut or shorten recurring meetings, test every recurring for 90 days.
- Time-box agenda items and add a clear decision owner.
- Replace status meetings with async updates or shared dashboards.
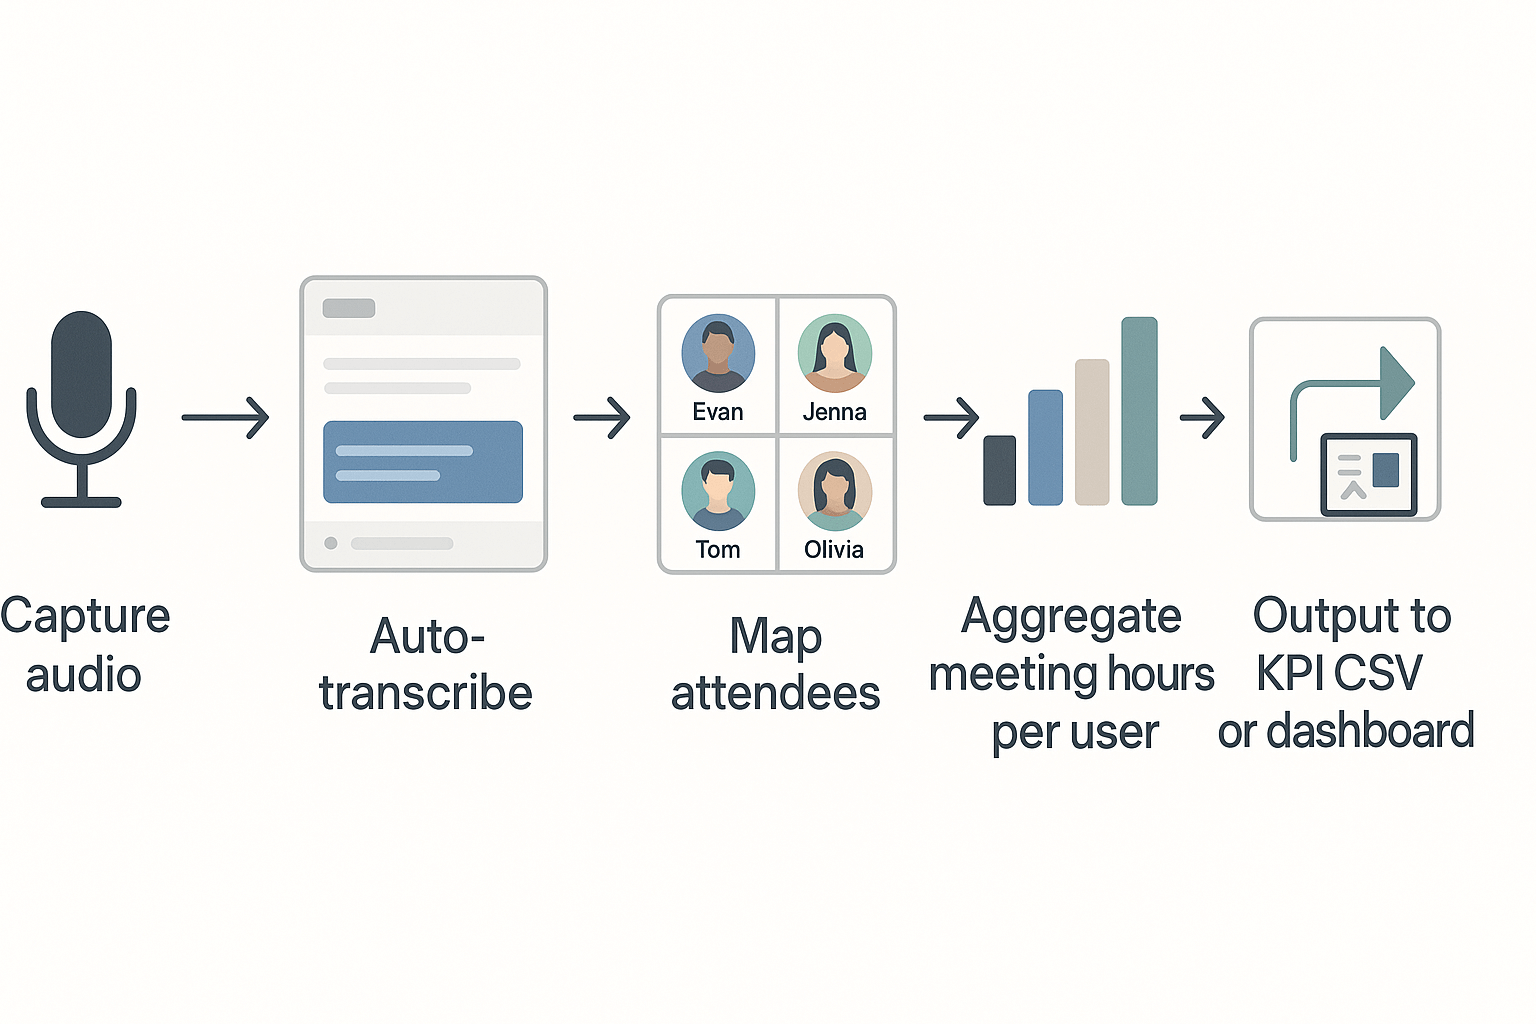
TicNote demo outline: auto-transcribe to hours dashboard
- Record meetings or upload recordings into TicNote and enable auto-transcribe.
- Tag meetings by type and map attendees in the meeting metadata.
- Export transcripts with minutes and attendee timestamps.
- Aggregate minutes by user and meeting tag in a CSV, then compute weekly person-hours.
- Visualize in your KPI dashboard to compare meeting types and identify targets to cut.
Metric 3 — Attendance & participation rate: Measuring engagement and inclusion
Good attendance and real participation matter more than headcount. Track attendance rate and participation signals to spot who shows up, who speaks, and who is left out. These meeting metrics help you improve inclusion, decision quality, and follow-through.
Attendance rate versus intended invitee rate
The attendance rate is simple: people present divided by people invited. The intended invitee rate measures how many of the intended decision makers or required roles actually come. Use these quick formulas:
- Attendance rate = (attendees / invited) x 100
- Intended invitee fulfillment = (key roles present/key roles invited) x 100
Compare both numbers to spot role gaps. Low intended invitee fulfillment often means decisions stall.
Participation metrics to track
Measure speaking time share, dialogue turns, chat activity, question rate, and reactions. Speaking time share is the percentage of the meeting audio by person. Dialogue turns count how many times each person speaks. Chat activity counts messages and threads. These metrics show who drives the meeting and who stays silent.
What different patterns signal
If one person owns more than half the speaking time, the meeting is top-down. If many attend but few speak, you likely have poor psychological safety or bad prompts. High chat but low voice participation can mean remote discomfort or time pressure. Use patterns to redesign role, agenda, or facilitation.
How to instrument participation
Combine transcript speaker labels, calendar invite lists, and chat logs. Add short pulse surveys and simple polls. Automate capture with live transcription and speaker diarization. Respect privacy by telling participants and storing data securely.
Benchmarks that suggest problems
Aim for attendance above 85 percent and intended invitee fulfillment above 90 percent. No single attendee should exceed 40 percent of speaking time. Target at least two dialogue turns per participant on average. Fewer signals mean act: change the agenda, invite fewer people, or add facilitation.
How TicNote can help
TicNote records and transcribes meetings and labels speakers automatically. Shadow AI scores participation, highlights dominant speakers, and surfaces muted topics across meetings. Use TicNote to build inclusion reports and export participation CSVs for your dashboard.
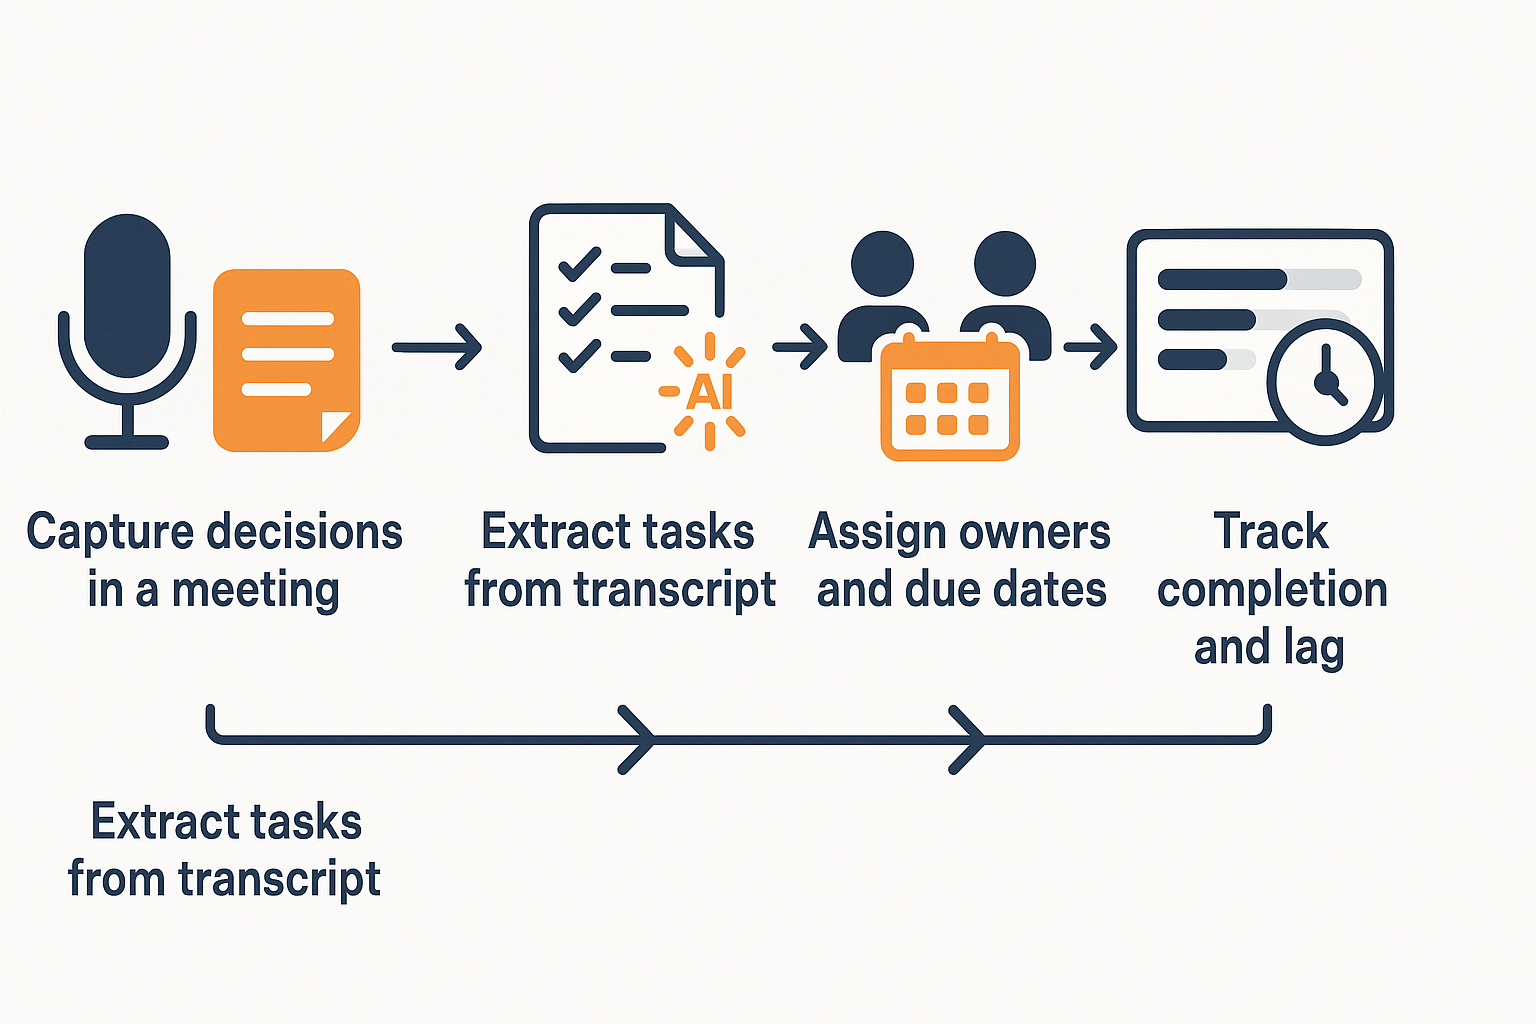
Metric 4: Action item completion & decision capture: From meeting to outcomes
An action item is a discrete task that follows from a meeting, with a named owner, a due date, and a clear success condition. Tracking these items turns talk into work and is a core meeting metric for teams that want reliable follow-through. Below is a simple capture method, formulas you can use, a short sprint case study, and a practical TicNote workflow to automate the loop.
Capture action items, step by step
- During the meeting, record the decision or task in one line: what needs doing, outcome, and context.
- Assign an owner by name, not role.
- Set a clear due date or sprint number.
- Mark status at capture: open, in progress, blocked, complete.
- Log the meeting date and link the transcript or notes.
Use a template for speed: Task | Owner | Due date | Status | Meeting | Notes.
Key formulas you can paste into a dashboard
- Completion rate = (Number of completed action items / Total assigned items) × 100%.
- Average lag time (days) = Sum(completion_date − meeting_date) / Number of completed items.
- Overdue rate = (Items past due and not complete / Total open items) × 100%.
These let you answer how many tasks finish, how fast, and where things stall.
Mini case study: one sprint win
A product team ran two-week sprints. Baseline completion was 56%. After enforcing owner assignment and automated reminders, completion rose to 88% in the next sprint. Average lag fell from 7.2 days to 2.6 days. The change came from clearer owners and two automated nudges per task.
TicNote workflow to automate capture and follow-up
- Record the meeting in TicNote and generate a transcript.
- Run Shadow AI task extraction to pull candidate action items from the transcript.
- Review and confirm ownership and due dates in the task list.
- Save tasks to the TicNote knowledge base so each item links to the meeting and transcript.
- Use Shadow to schedule reminder nudges and to produce weekly task-status summaries.
- Export the task CSV to your KPI dashboard, or monitor completion rate in TicNote.
Metric 5 — Meeting effectiveness & sentiment (post-meeting outcomes)
Track whether meetings actually moved work forward, not just how long they ran. Use a short post-meeting survey to capture attendee sentiment, map outcomes to concrete decisions, and then roll up sentiment scores into a trends view. This is a practical meeting metrics approach you can run every day.
Quick post-meeting survey (one-page template)
Keep it tiny, one screen. Send immediately after the meeting.
- Q1: Overall meeting rating (0 to 10) — NPS-style.
- Q2: Was a clear decision made? (Yes / No)
- Q3: Were the next steps assigned to owners and due dates? (Yes / No)
- Q4: How useful was the meeting for your work? (Not useful / Somewhat / Very useful)
- Q5: Any blockers or follow-up requests? (Short text)
Scoring: convert Q1 to a 0–10 score, treat Yes as 1 and No as 0 for Q2 and Q3, and map Q4 to 0, 1, 2. Combine into a composite effectiveness score per meeting.
How to correlate sentiment and outcomes with business metrics
- Pick 2 to 3 outcome KPIs: task completion rate, sprint velocity, sales pipeline change, or churn risk indicator.
- Aggregate meeting sentiment and effectiveness by team and week.
- Run a simple correlation (Pearson or Spearman) between average effectiveness and each KPI by week.
- Drill into outliers: high volume of meetings with low scores often precedes missed deadlines or slower pipeline movement.
This gives a directional link between meeting quality and business outcomes, not causation.
Automate with TicNote
Use TicNote to host the survey link in the meeting summary and capture replies in the meeting note. TicNote can tag decisions and action items automatically, then roll up a sentiment field across meetings for trend charts. Shadow AI can summarize themes from short-text responses so you see recurring blockers fast.
Putting it together: Practical dashboard, tooling, and rollout plan (includes TicNote walkthrough)
Start with a simple dashboard that shows your five core meeting metrics in one view. The dashboard makes meeting metrics visible, so teams can act. Include trends and per-person breakdowns to spot overload and gaps.
What to include in the KPI dashboard
- Core widgets: recurring meeting count, total meeting hours, hours per person, attendance rate, action item completion, and meeting sentiment.
- Data sources: calendar logs, meeting transcripts, task trackers, and post-meeting surveys.
- Export: provide a downloadable CSV template for weekly or monthly exports so managers can slice data offline.
30/60/90 day rollout checklist
- Days 1–30: Pilot with one team. Turn on live transcription and note templates. Track baseline for the five metrics and run a weekly review.
- Days 31–60: Expand to 2–3 teams. Add automated action-item capture and set SLA for task completion. Train leads on the dashboard and run improvement sprints.
- Days 61–90: Standardize templates and reporting cadence. Set org-level targets for time saved and action completion. Add monthly cross-team reviews.
This approach shows how to measure meeting effectiveness and create fast wins.
Quick tool comparison: TicNote vs Otter vs Fireflies
| Tool | Live transcription | AI summaries & search | Integrations | Privacy / Enterprise |
| TicNote Cloud | Yes | AI notes, Shadow, mind maps | Notion, Slack, exports | Private by default, enterprise SSO |
| Otter | Yes | Summaries, highlights | Slack, Zoom | Good for SMBs, limited enterprise controls |
| Fireflies | Yes | Auto-notes, task markers | Many meeting platforms | Enterprise features vary |
Governance, retention, and consent checklist
- Policy: define who can record and why. Mention GDPR and local regulator guidance.
- Consent: Use explicit consent prompts for recorded calls.
- Retention: set clear retention windows and auto-delete schedules.
- Access: restrict transcripts to role-based groups and audit access logs.
- Training: brief teams on data use and opt-out options.
Use the CSV template to start. Run a 30-day pilot, then scale with clear governance.