
TL;DR: What this guide covers and the quick win
Meeting sentiment analysis measures how people feel during or after a meeting by assigning sentiment scores to speech and text. This guide shows why that matters, how to compute scores from transcripts, and how to turn emotion signals into action. Quick win: run sentiment analysis on one meeting transcript to surface the top positive and negative moments, three likely risks, and the actions people missed in under 15 minutes.
What to expect: a clear definition, a product-led walkthrough, a step-by-step checklist you can follow, sample score thresholds, and short case studies that show measurable ROI. You will also get tuning tips, prompts for contextual chat, and a frank look at privacy and limits. Read on to learn how simple metrics like overall mood, topic-level sentiment, and speaking-time balance help teams improve decisions, follow ups, and attendee experience.
What is meeting sentiment analysis (simple explanation)
Meeting sentiment analysis measures the feelings and tone inside a meeting. It turns words, voice, and visual cues into data about mood, engagement, and reaction. This helps teams spot positive moments, friction, and where to follow up.
How meetings feed models
Meeting data comes from a few clear sources:
- Transcript text: the literal words from live or uploaded meetings.
- Speech signals: pitch, volume, speaking pace, and pauses.
- Video cues: facial expressions, eye contact, and gestures when available.
- Context data: speaker labels, timestamps, chat messages, and reactions.
Each source adds a layer of evidence. Text shows what was said, audio shows how it was said, and video shows nonverbal signals.
Common outputs you'll see
- Sentiment scores: numeric values indicating polarity, often on a scale like -1 to 1 or 0 to 100.
- Categorical labels: simple tags such as positive, neutral, or negative.
- Emotion labels: finer categories like joy, confusion, frustration, or agreement.
- Segment-level results: per speaker, per topic, or per timestamped clip.
- Confidence and metadata: model certainty and links back to the exact transcript lines.
Those outputs can populate dashboards, power alerts for risky calls, or feed automations that create follow-up tasks. Want a quick win? Run sentiment at the topic level to find the parts of meetings that need action.
Why meeting sentiment analysis matters for teams and events
Meeting sentiment analysis gives teams a clear read on how people feel during conversations. It turns words and pauses into measurable signals about engagement, confidence, and friction. With that data, teams can spot problems faster and run better follow ups.
Why measure emotion in meetings
Feeling is data. Tracking tone and emotion helps hosts and organizers see if people stay engaged, if decisions land, and if attendees leave confused or frustrated. It also flags subtle patterns, like repeated hesitation from the same participant, that a simple attendance report will miss. Want to reduce churn or run better events? Start by listening to sentiment.
Practical use cases
- Engagement tracking: measure talk time, sentiment by segment, and participant reactivity.
- Feedback signals: surface praise, complaints, and unmet expectations from attendees.
- Risk detection: find hesitation, repeated negation, or conflict before it escalates.
- Decision confidence: verify whether a recorded decision had positive, neutral, or negative tone.
- Event scoring: compare session sentiment across speakers and formats to optimize programs.
KPIs to track and how they map to business outcomes
Focus on a short list of KPIs you can act on. Each KPI ties back to better meeting outcomes or business metrics.
- Average sentiment score (normalized): a single number for session mood. Track trends weekly to spot declines.
- Engagement rate: percent of active participants by speaking or reacting. Low engagement often predicts low follow‑through.
- Hesitation index: counts pauses, filler words, or repeated corrections. High values point to unclear decisions or lack of confidence.
- Action-item positivity: percent of tasks assigned with positive phrasing or clear buy-in. This predicts completion rates.
- Voice-of-customer signal strength: frequency of praise vs complaint language. This links to NPS and satisfaction.
When sentiment trends drop, teams see downstream effects: fewer completed actions, lower attendee NPS, and slower decision cycles. Run a quick baseline across a few meetings, then monitor the metrics above to test improvements in facilitation or agenda design.
How TicNote Cloud captures and computes meeting sentiment
Meeting sentiment analysis begins with good data. TicNote Cloud takes audio or uploaded files, turns them into clean transcripts, and runs sentiment models at the utterance and meeting level. This section maps the end to end flow, and shows how transcription, translation, AI summaries, Shadow chat, and mind maps feed reliable sentiment scores.
From audio to score: the TicNote pipeline
- Capture and ingest. Recordings come from live capture, browser extensions, or file uploads. TicNote stores audio securely and tags source metadata.
- High accuracy transcription. Automatic speech recognition (ASR) converts audio to time‑stamped text, with speaker labels and confidence scores. Clean transcripts are the base signal for sentiment models.
- Language detection and translation. Non‑English content is auto‑detected and translated. That keeps sentiment models comparing apples to apples across languages.
- Preprocessing and denoising. TicNote applies punctuation, filler removal (ums, ahs), and normalization. It flags low‑confidence sections for review.
- Sentiment scoring. The Shadow AI runs sentence and utterance level scoring, then aggregates to topic segments and the whole meeting.
- Post‑processing and visualisation. Scores feed dashboards, mind maps, and Shadow chat so teams can explore sentiment by speaker, topic, or time window.
How TicNote modules contribute to accuracy
- Transcription. Accurate text is critical. This feature lets sentiment models ignore uncertain words.
- Translation. The system translates transcripts into a common language, reducing false negatives from idioms and mismatches.
- AI summaries. Topic‑aware summaries group related utterances, letting the system compute sentiment per decision, action item, or agenda point.
- Shadow chat. Ask targeted questions about sentiment, such as why a topic trended negative. Shadow grounds answers to the transcript and shows evidence spans.
- Mind map. Visual nodes show sentiment per topic, with color cues and drilldowns into the supporting text.
How scoring works, simply put
TicNote combines lexical signals, context models, and confidence weighting. Short utterances get sentence scores. Longer topic blocks get weighted averages, where low‑confidence transcript segments count less. The system also reports a confidence band, so users see when scores are solid or noisy.
Benchmarking matters. According to A Comparative Study of Sentiment Analysis on Customer Reviews Using Machine Learning and Deep Learning (2024), The Logistic Regression model achieves an overall accuracy of 99% in sentiment analysis of customer reviews. Use such benchmarks as a guide, not a guarantee for meetings, which are more conversational and noisy.
How TicNote reduces noise and improves signal
- Confidence filtering: ignore or flag transcript parts below a threshold.
- Filler and overlap removal: cleaner text reduces false polarity flips.
- Topic grouping: aggregate many utterances to smooth out short emotional spikes.
- Human review hooks: mark sections for manual correction before final scoring.
What you get is a practical output: per‑speaker and per‑topic sentiment scores, time series charts, and linked evidence. Those outputs power action, like surfacing a stressed client comment or a recurring negative topic across meetings.

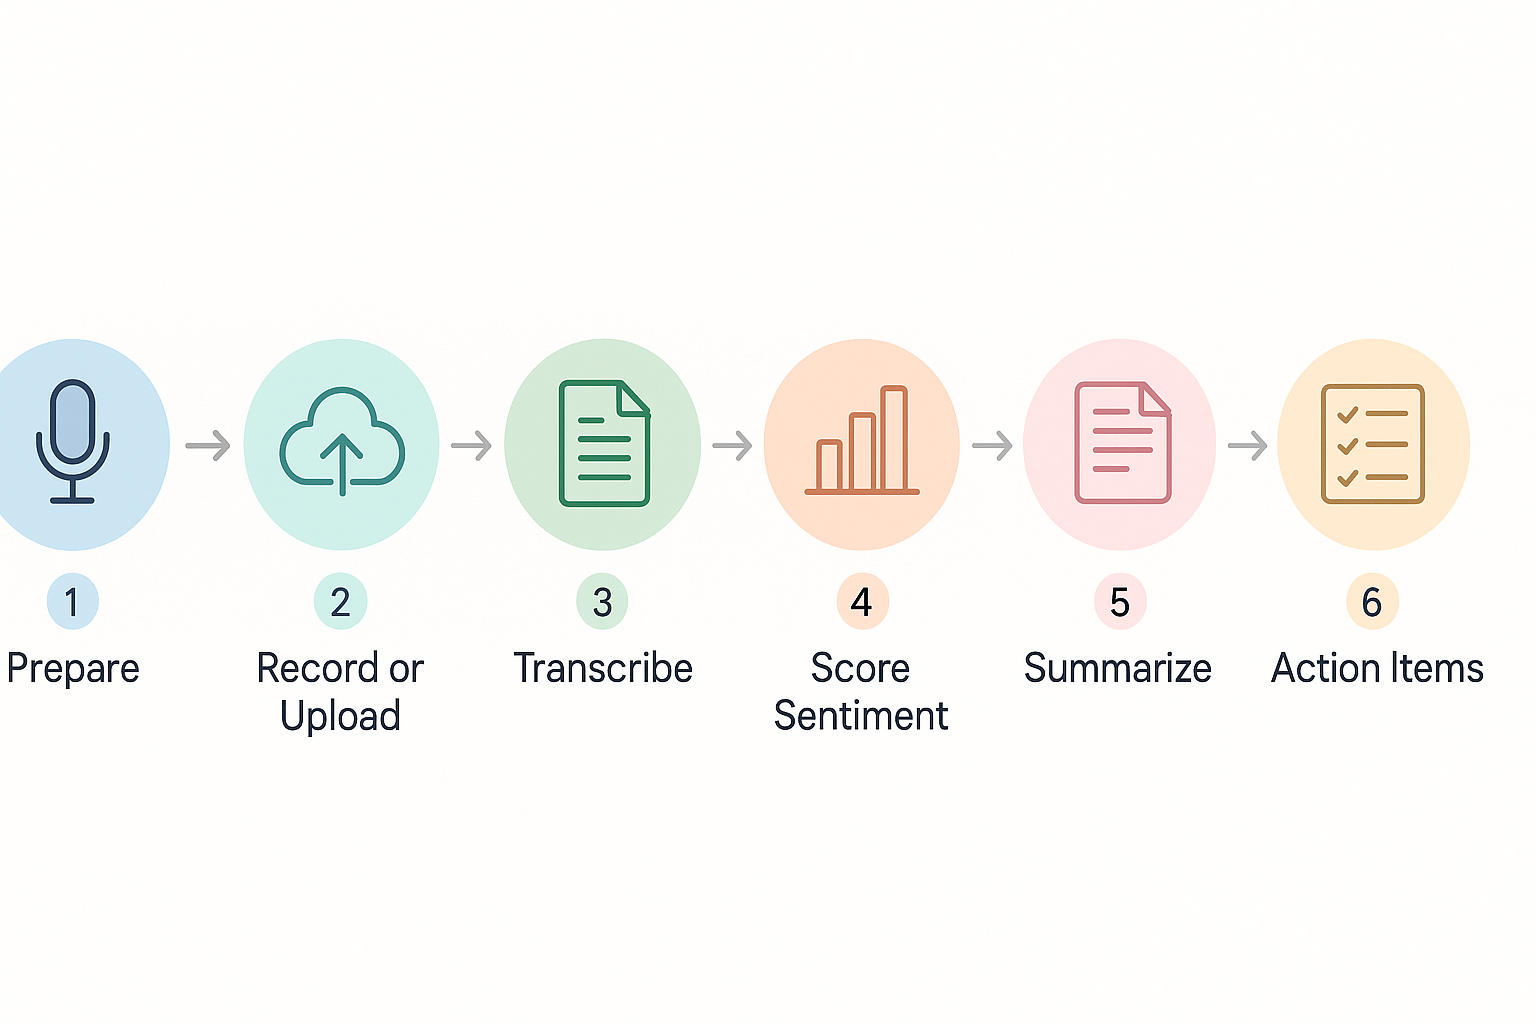
Step-by-step implementation: run your first sentiment analysis on a meeting
Start simple and get repeatable results. This guide walks you through what to prepare, how to record or upload a meeting, and which TicNote Cloud features to use to generate sentiment scores, topic summaries, and mind maps. You will finish with a short checklist, sample Shadow chat prompts, and audio and privacy tips to make the first run reliable.
Before you start: quick prep and consent
Set goals first: what do you want to measure, mood, engagement, or topic heat? Pick one clear outcome. Tell attendees you will record and why, and get verbal or written consent. Prepare a short agenda and a mic test message so audio quality stays high.
Checklist:
- Confirm recording permissions from all attendees.
- Share a 1-line purpose for analysis.
- Add time stamps or agenda topics to help later review.
- Reserve a quiet room and use a headset mic when possible.
Record or upload: three simple ways
- Live capture using the TicNote Chrome extension or app recording. Use live transcription for immediate notes.
- Import recorded audio or video to TicNote after the meeting. Upload WAV, MP4, or common formats.
- Paste or import meeting files from drives or calendar recordings for batch analysis.
Transcribe and compute sentiment: step by step
- Open the meeting file or start live recording in TicNote.
- Choose a language and enable AI transcription. TicNote supports multilingual transcripts and translation.
- Let the system produce a speaker‑segmented transcript. Each segment gets a timecode.
- Run the Shadow AI. TicNote scores sentiment for segments and the whole meeting, producing sentiment scores and an emotion summary.
Sample sentiment score thresholds:
- 0.0 to 0.3: negative tone, requires follow-up.
- 0.3 to 0.7: neutral, mixed signals.
- 0.7 to 1.0: positive, high engagement.
These thresholds are a starting point. Tune them for your team and meeting type.
Generate summaries, mind maps, and actions
Use AI Summaries to pull out decisions and tasks. Open Mind Map to create a visual from topics and sentiment highlights. Then use Shadow chat for focused queries, like extracting root causes or spotting high‑tension moments.
Sample Shadow chat prompts:
- "Show me the top negative moments and the speaker for each."
- "List decisions with confidence level and relevant quotes."
- "Which agenda items had the most positive sentiment?"
Audio best practices
- Use a close microphone or headset.
- Ask remote attendees to mute when not speaking.
- Remove background music and trim noisy clips before upload.
- Record at 16 kHz or higher for best transcription accuracy.
Privacy, consent, and storage
Never analyze recordings without consent. Store raw audio securely and limit access. If required, redact or delete private segments. TicNote Cloud is private by default, but follow your company policy and legal guidance.
Copyable checklist (repeatable)
- Set analysis goal and agenda.
- Get consent and record.
- Upload to TicNote or use live capture.
- Run transcription, then sentiment scoring.
- Generate AI summary and mind map.
- Use Shadow chat to pull actions and quotes.
- Share findings and assign follow-ups.
This hands‑on flow turns meetings into measurable insights quickly. Use the checklist above to run your first analysis and tune score thresholds for your context.
Real-world case studies & measurable ROI
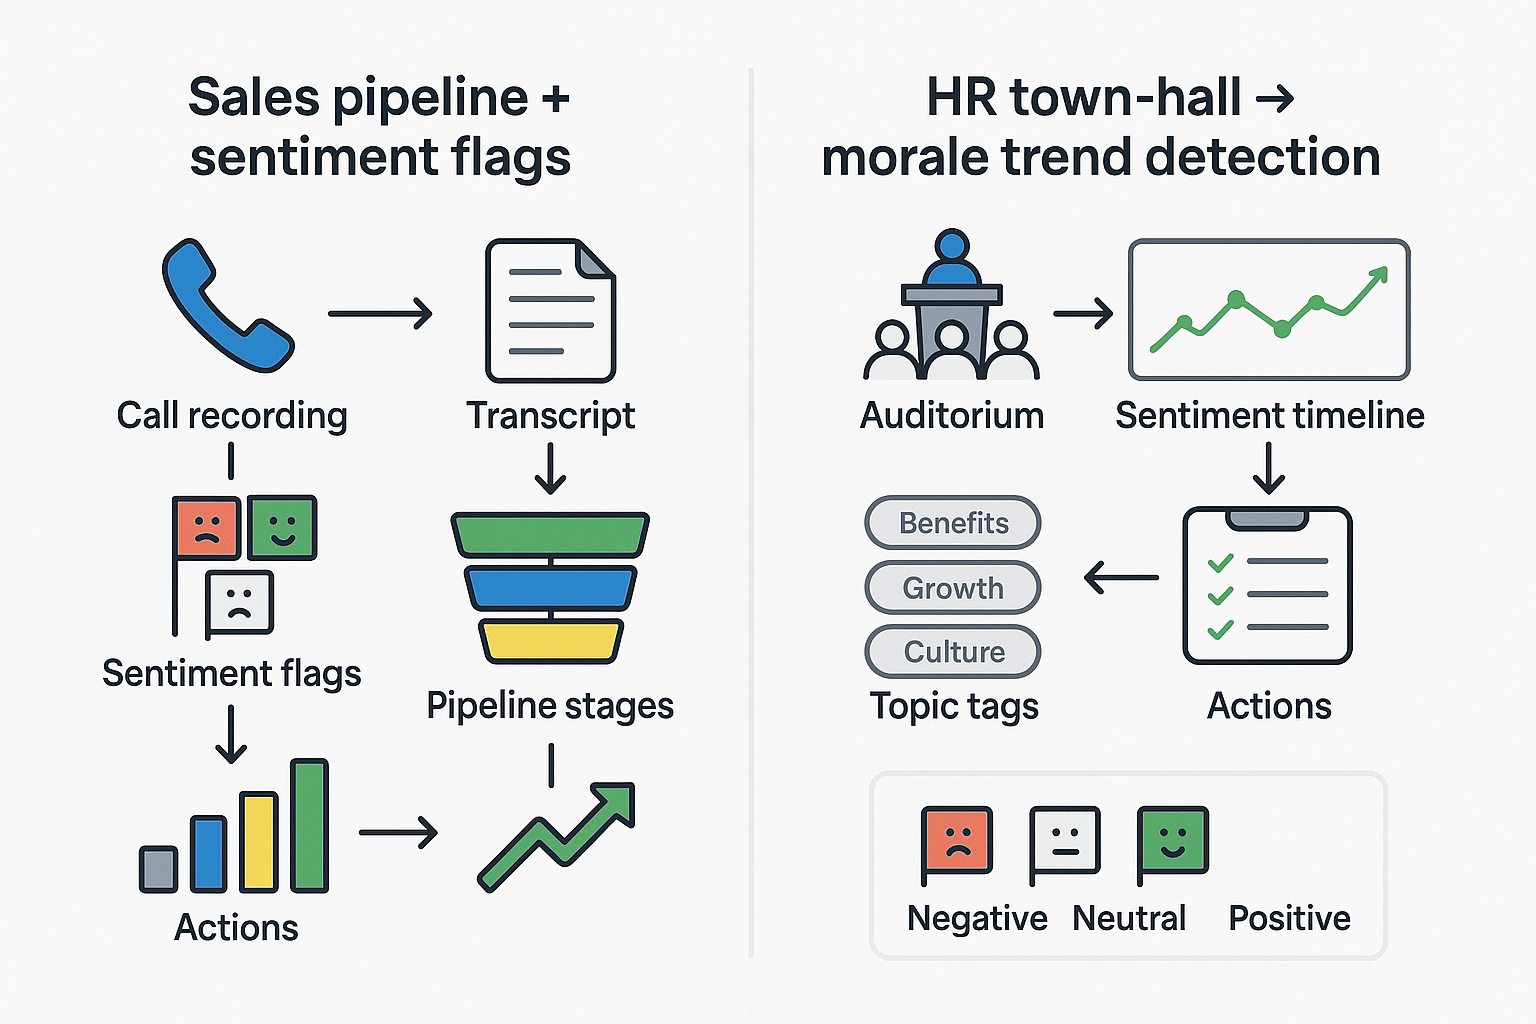
Meeting sentiment analysis can turn feelings into actionable signals. These two short case studies show how teams used sentiment flags and trends to change outcomes. You’ll get the metrics to track, the before‑and‑after measurements, and typical time savings and insight lift to expect.
Sales team: Use sentiment flags to improve close rates
A mid-market sales team added sentiment flags to every demo and discovery call. They tagged calls with negative, neutral, or positive flags based on transcript tone and customer language. Reps reviewed flagged moments before follow-up and tailored proposals to objections surfaced by the analysis.
What they measured before and after:
- Close rate by rep and by cohort.
- Deal velocity, from demo to contract.
- Stage conversion rates (demo→proposal, proposal→close).
- Number of follow-up touches and time to first follow-up.
Results to expect: teams often see clearer win/loss patterns within 6–12 weeks. Typical improvements include a 10 to 20 percent lift in close rate for flagged deals, and a 10 to 15 percent reduction in sales cycle time. Reps also report saving 2–4 hours per week because sentiment highlights replace manual note review.
HR team: track morale from town halls and all-hands
An HR team used sentiment trend lines from quarterly town halls to spot morale shifts. They combined sentiment with topic extraction to find whether concerns were pay, workload, or leadership communication. That let HR prioritize pulse surveys and targeted action plans.
Metrics to track before and after:
- Average sentiment score per event and per department.
- Topic-weighted sentiment (how people feel about specific themes).
- Action closure rate and time to implement changes.
- Employee engagement and internal survey scores.
Outcomes: HR teams typically detect issues earlier, cutting investigation time by 30 to 50 percent. Faster detection leads to quicker, focused interventions and clearer follow-up plans. Over a quarter, teams report improved alignment between survey answers and real-time sentiment trends.
What to measure and a quick checklist
- Baseline metrics: close rate, cycle time, engagement scores, and current note-taking hours.
- Implement: capture transcripts, compute sentiment, tag key moments, and route actions.
- Reassess at 6 and 12 weeks, compare averages and percent change.
Expected insight lift: expect 2x to 4x more actionable moments surfaced per meeting, and 20 to 40 percent less time spent on manual summarization.
Comparing TicNote to other AI tools for sentiment analysis
If you’re evaluating tools for meeting sentiment analysis, focus on features that matter: cross-meeting context, visual summaries, and research output. TicNote stands out for its cross-file Q&A (Shadow), automatic mind maps, and deep research reports. Those features help turn sentiment scores into action across projects.
Feature gaps that matter
- Cross-file context: TicNote’s Shadow chat lets you ask across meetings and files. Otter, Fireflies, and Fathom typically limit analysis to a single session. That matters when you want trends across weeks.
- Visuals and synthesis: TicNote auto-generates mind maps and research reports. Competitors give transcripts and short highlights, but few produce structured research you can reuse.
- Translation and multilingual support: TicNote includes AI translation for 100-plus languages. That reduces bias when you analyze sentiment across global teams.
Pricing and scale, and what it means for sentiment projects
TicNote’s free tier covers light testing, with 300 transcription minutes per month. Professional ($$12.99/month) adds 1,500 minutes and unlimited AI chat, which suits month-long pilot projects. Business $$29.99/month) raises limits for full program rollouts. For large-scale, privacy-sensitive work, Enterprise offers SSO and custom usage.
Smaller tools may look cheaper, but they often limit exports, cross-meeting search, or long-term memory. That drives manual work and higher total cost when you run ongoing sentiment monitoring.
Quick comparison table
| Feature | TicNote Cloud | Otter | Fireflies | Fathom |
| Cross-file Q&A | Yes | No | Limited | No |
| Mind maps & research | Yes | No | No | No |
| Live translation | Yes | Limited | No | No |
| Pilot-friendly free tier | Yes | Yes | Yes | Yes |
TicNote is built for teams that want sentiment insights linked to action. If you need cross-meeting trends, visual synthesis, and enterprise privacy, TicNote’s combination of features and tiered minutes makes it a practical choice for scalable sentiment projects.
Challenges, limitations, privacy & ethical considerations
Meeting sentiment analysis is useful, but it’s not a substitute for human judgment. Models struggle with sarcasm, cultural nuance, and short or noisy audio. Those limits can distort sentiment scores and cause teams to misread morale or client reactions.
Common pitfalls when measuring emotion
- Sarcasm and irony: models read words, not intent, so a joking “great” can show up as positive.
- Cultural and language nuance: expressions differ across regions, which skews results for multilingual teams.
- Speaker attribution errors: wrong speaker labels mix sentiments across people, hiding who actually felt what.
- Thin data and edge cases: short meetings, poor audio, or sparse comments make scores unreliable.
Privacy and compliance checklist
Use this practical checklist before you store or act on sentiment data:
- Get informed consent, and make withdrawal easy. Note that Article 7(3) of the General Data Protection Regulation states that “The data subject shall have the right to withdraw his or her consent at any time.”
- Limit use to clear purposes, and avoid scope creep.
- Minimize data: store only transcripts and metadata you need for analysis.
- Retention policy: set automatic deletion windows and justify longer storage.
- Opt-out and no-bot options: allow participants to record offline or decline sentiment analysis.
- Access control and audit logs: restrict who can view raw transcripts and sentiment outputs.
- Anonymize or pseudonymize results for reporting to reduce reidentification risk.
- Review third-party contracts and encryption standards for processors.
- Conduct a Data Protection Impact Assessment (DPIA) for sensitive use cases.
How TicNote's privacy choices reduce risk
TicNote Cloud is private by default and does not use customer data to train models. The platform uses industry standard encryption and supports enterprise features like SSO and dedicated support. Teams can export or delete transcripts on demand, and use local capture or no-bot recording to honor meeting policies. These controls help keep sentiment analysis actionable, while reducing legal and reputational risk.
Treat sentiment outputs as a directional signal, not an absolute truth. Combine them with human follow up and clear privacy practices to get value without harming trust.
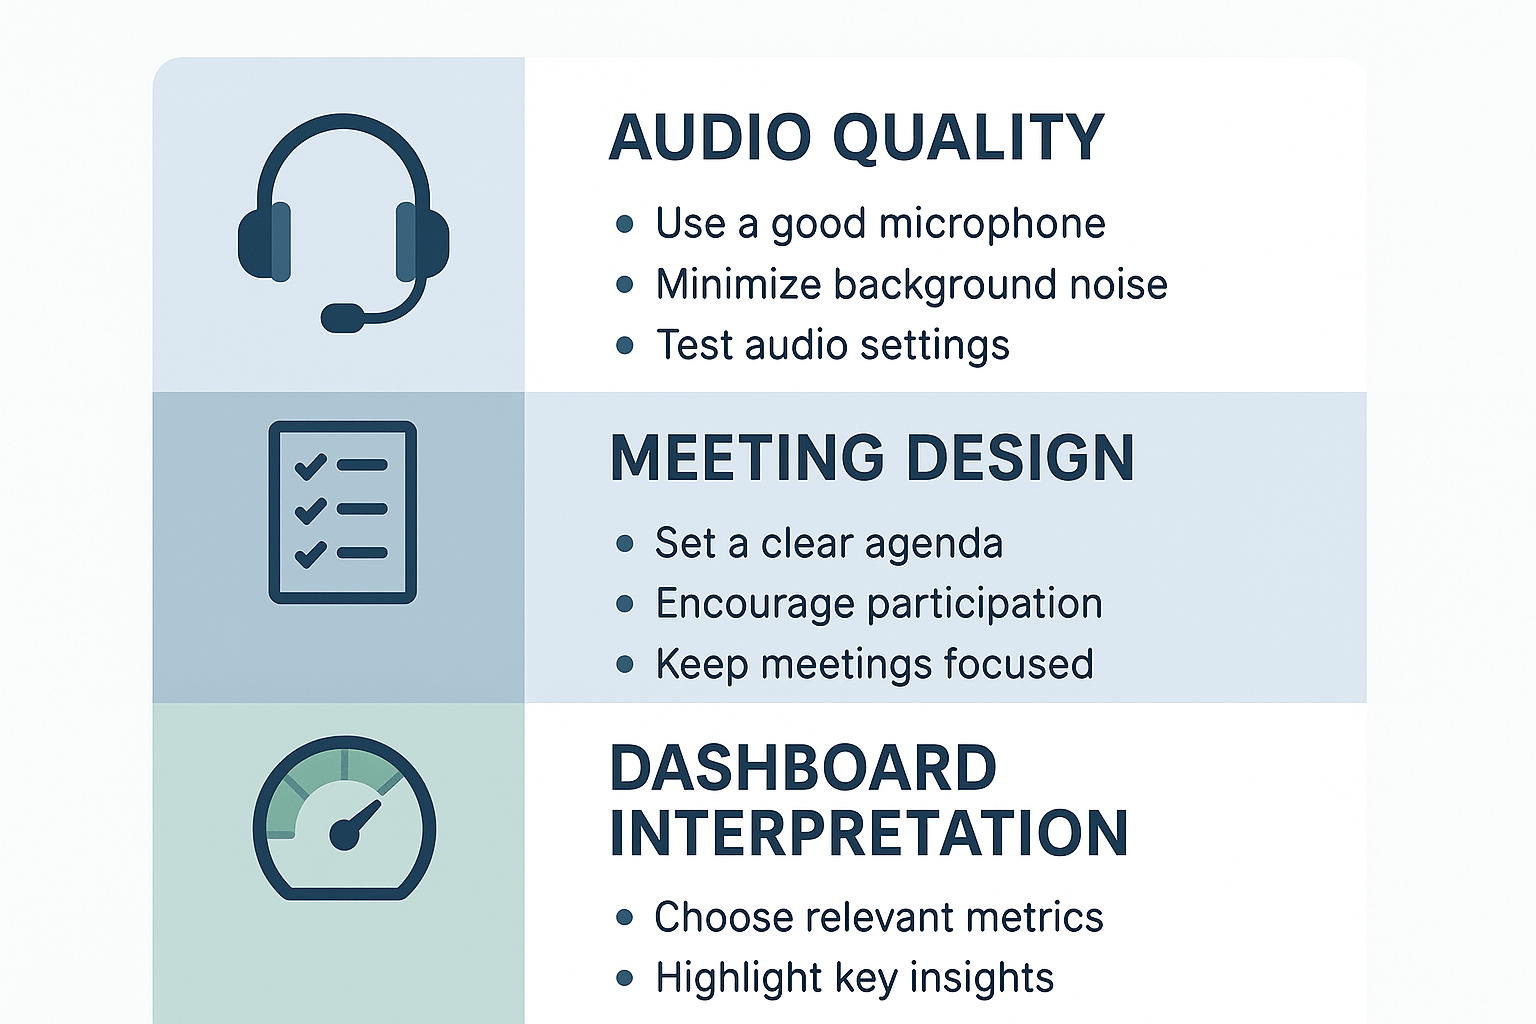
To get reliable meeting sentiment analysis, you need clean inputs and a repeatable review loop. This short checklist focuses on three simple areas: audio and metadata, meeting design, and dashboard tuning. Follow these steps, and your sentiment scores will become more accurate and more actionable.
Improve audio and speaker data
- Use a headset or desktop mic to reduce room echo and background noise. Clear audio makes sentiment models more confident.
- Record locally when possible, or use TicNote Cloud’s high-accuracy transcription to capture tough audio.
- Enable speaker labels or ask attendees to state names at the start. Labeling speakers avoids mixed signals and improves per-person sentiment metrics.
- Keep meetings short and single-topic where you can, so emotional shifts are easier to detect.
Design meetings for clearer signals
- Start with a short mood check, like a one-line status or emoji. That gives a baseline to compare against.
- Ask focused, open questions and pause between speakers. Short turns improve sentiment detection.
- Use structured segments: update, discussion, decision, actions. Tag segments in the transcript for easier analysis later.
Tune your models and dashboards
- Calibrate score thresholds with human checks. Review 10 to 20 samples to set what counts as neutral, positive, or negative.
- Use translation features carefully; translate transcripts before scoring if meetings use mixed languages.
- Build short prompts for Shadow chat to flag sarcasm or mixed sentiment, then refine over time.
Post-meeting checklist
- Confirm speaker labels and correct any misattributions.
- Trim obvious noise sections from the transcript.
- Run sentiment analysis and tag segment types.
- Spot-check 10 random excerpts for accuracy.
- Update thresholds or prompts if errors repeat.
- Link sentiment insights to action items and store them in the project space.
Use these steps to keep sentiment data consistent and trustable over time.