


 Extension
TL;DR: skill agent playbook for faster competitor research
If you need a faster way to build a competitive analysis report, try TicNote Cloud for free: the goal is a repeatable report with fixed fields, simple scoring, action priorities, and presentation-ready output. This guide is for marketers, product managers, consultants, founders, and cross-functional teams that need a practical workflow, not a theory-heavy market analysis exercise.
Manual competitor research usually breaks down when notes live in too many places, evidence is uneven, and no one trusts the final score. That leads to slow decisions and stale reports. With a workspace that turns raw notes, calls, and documents into structured reports, teams can keep sources together, validate gaps, and move from findings to actions faster.
- Choose one goal for the report.
- Limit the competitor set to the most relevant players.
- Collect evidence in the same format every time.
- Flag and validate weak or missing data.
- Turn findings into clear decisions and priorities.
- Keep the report simple enough to refresh on a set cadence.
What makes a strong competitive analysis report?
A strong competitive analysis report helps a team make decisions. It is not a folder full of screenshots, copied pricing pages, and loose notes. The best reports answer practical questions fast: who the real alternatives are, how each competitor positions itself, where they win or fall short, what patterns show up across pricing, features, channels, and customer sentiment, and what the team should do next.
Answer the questions that matter
A useful report should make five things clear:
- Who customers compare you against
- What each competitor sells and for whom
- How they package, price, and message the offer
- Where market gaps, risks, and weak spots appear
- Which actions deserve priority now
If those answers are missing, the report is not finished. It is just research inventory.
Include core fields early
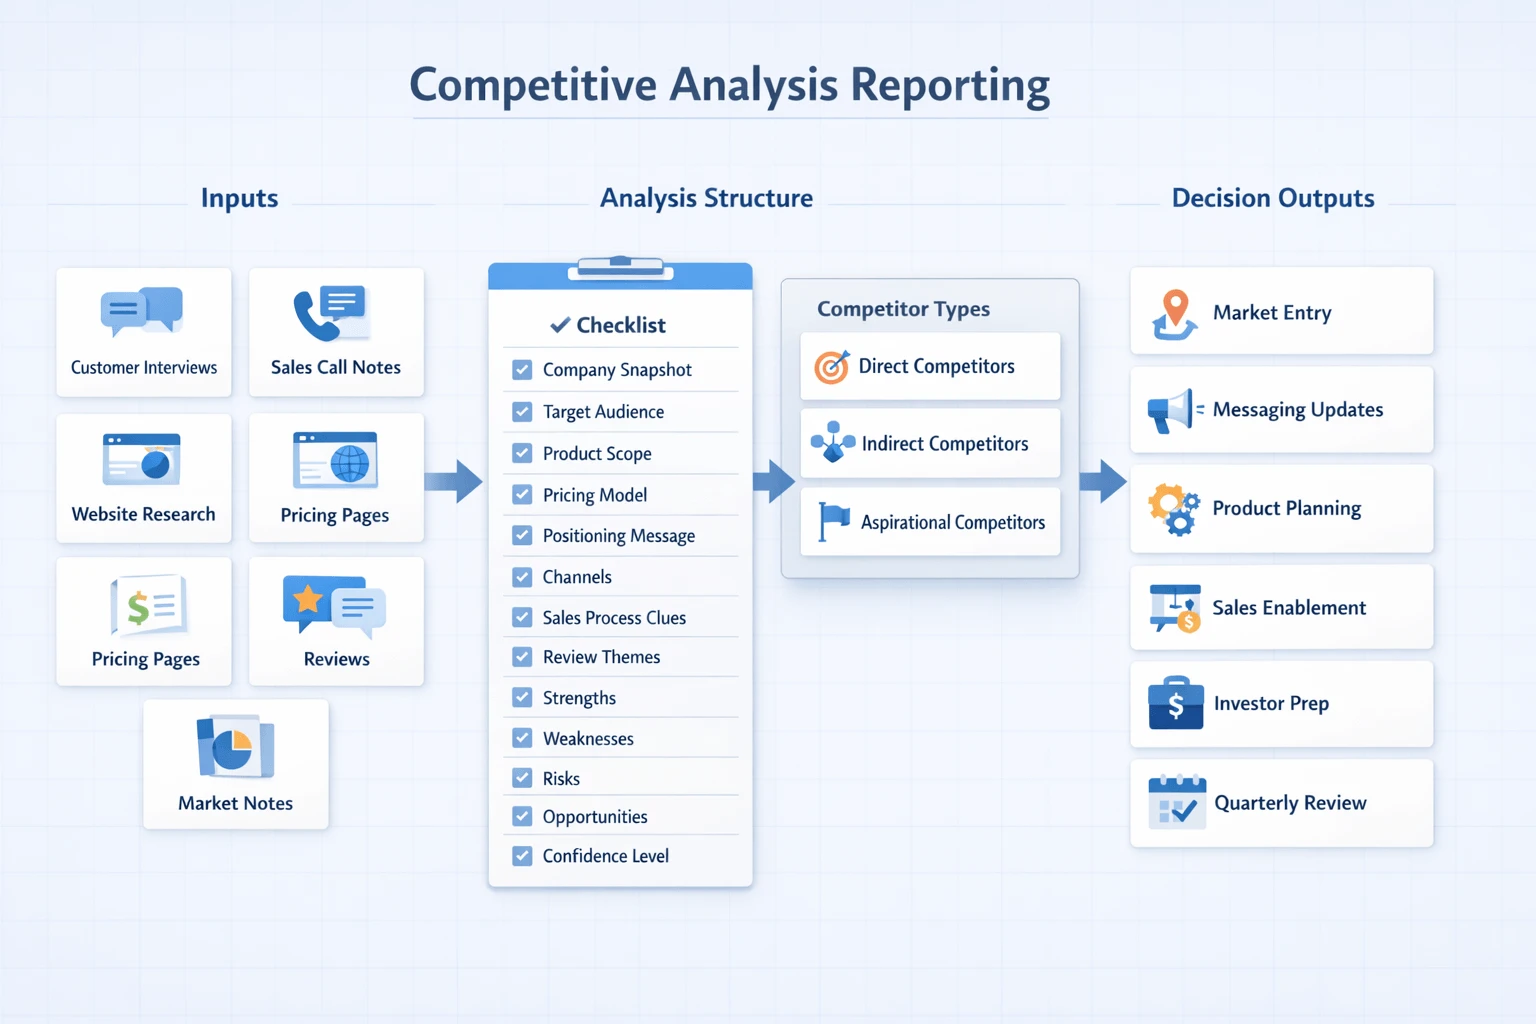
Start with a simple checklist so every company is reviewed the same way.
| Field | What to capture |
| Company snapshot | Size, geography, category, maturity |
| Target audience | Buyer type, team size, industry |
| Product or service scope | Core offer, add-ons, limits |
| Pricing model | Free trial, tiers, usage-based, custom quote |
| Positioning message | Main homepage claim or value proposition |
| Channels | SEO, paid search, social, partnerships, outbound |
| Sales process clues | Demo-first, self-serve, sales-led, free signup |
| Review themes | Repeated praise, complaints, feature requests |
| Strengths | Clear advantages backed by evidence |
| Weaknesses | Gaps, friction, unclear messaging |
| Risks | Fast-moving threats, market overlap, pricing pressure |
| Opportunities | Gaps your team can exploit |
| Confidence level | High, medium, or low evidence confidence |
That last field matters. Some findings come from direct proof. Others are inference. Mark the difference.
Separate direct, indirect, and aspirational competitors
Not all competitors belong in the same bucket:
- Direct competitors solve the same problem for a similar buyer
- Indirect competitors solve it differently or serve an adjacent need
- Aspirational competitors are larger or more advanced players worth learning from
Most teams should start with three to five direct competitors. That keeps the report focused and comparable. Then add a few indirect or aspirational names for context.
Use the report when decisions are near
This kind of report is most useful during:
- Market entry planning
- New product or feature strategy
- Messaging and positioning updates
- Sales enablement prep
- Investor or board preparation
- Quarterly strategy reviews
The format can be text-first, spreadsheet-based, or visual. What matters is that it stays evidence-based, easy to compare, and simple to update.
How to write competitive analysis step by step
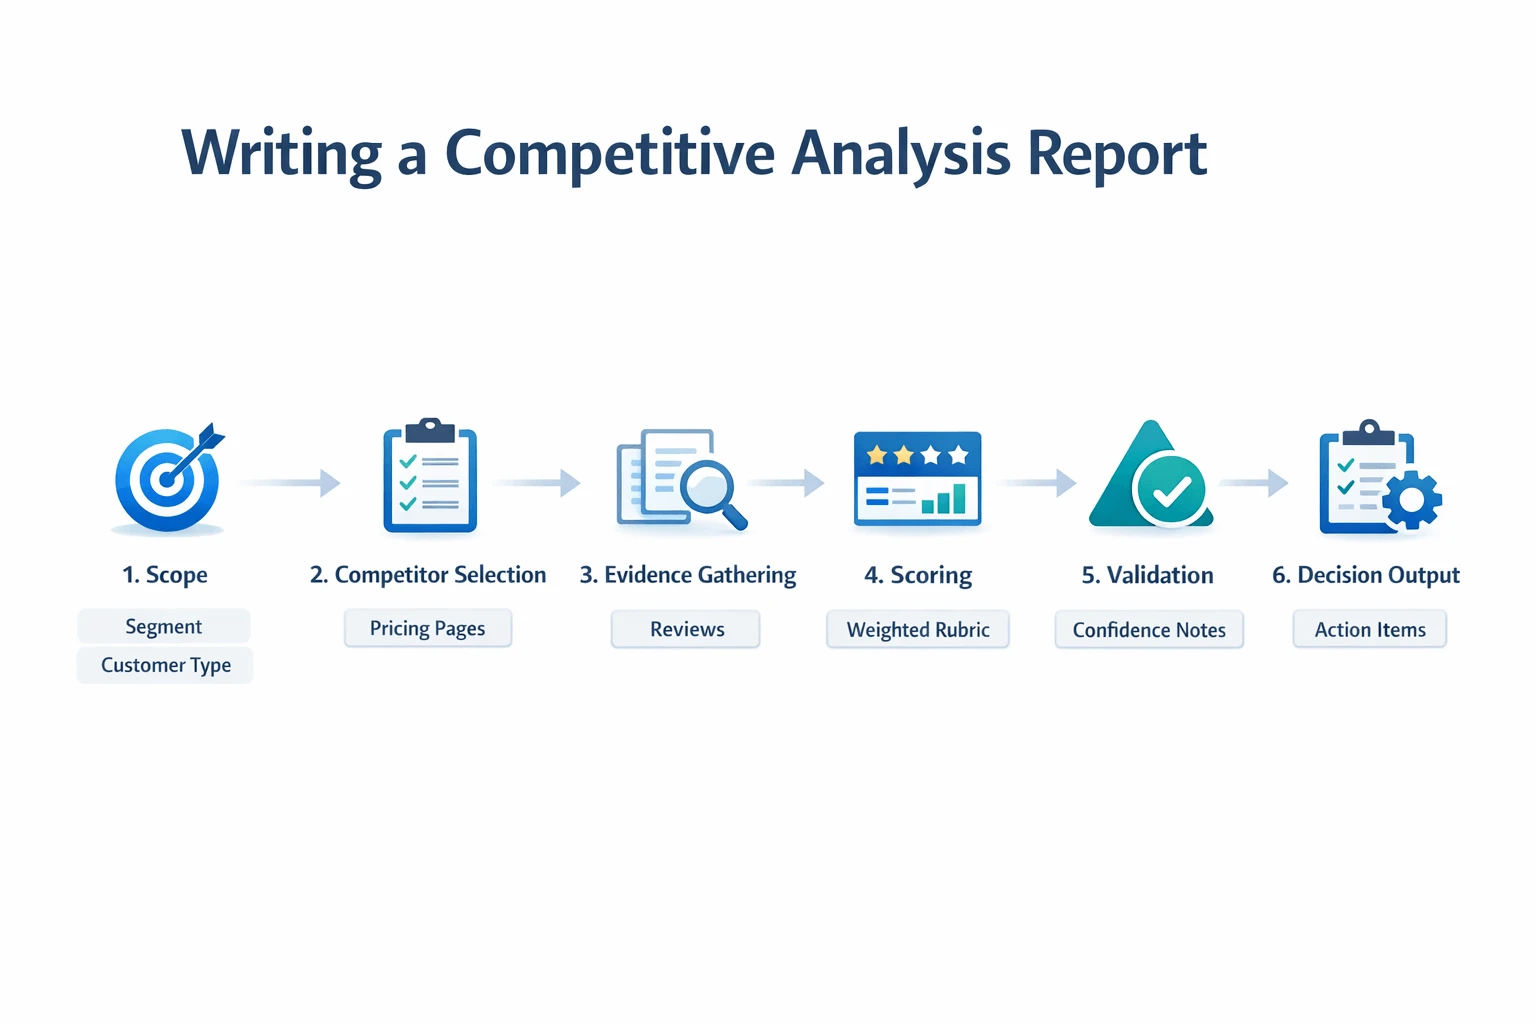
A useful competitive analysis report should help a real decision get made. That's why the best process starts with scope, then moves into competitor selection, evidence gathering, analysis, scoring, validation, and action. If you skip that order, the report often turns into a pile of facts with no clear next step.
Set the goal and scope first
Start with the decision the report needs to support. Are you refining pricing, tightening positioning, planning a launch, or preparing a sales battlecard? Write that down in one sentence.
Then narrow the scope across four filters:
- Market segment
- Region
- Customer type
- Timeframe
For example, "analyze project management tools for U.S. SaaS teams with 20 to 200 employees over the last 12 months" is far better than "analyze workflow software." A tight scope makes the research faster and the findings more credible.
Build a long list, then prioritize competitors
Most teams begin with too few names. Build a broad list first from:
- Search results for core category terms
- Review sites like G2 or Capterra
- Sales call mentions and lost-deal notes
- Reddit, LinkedIn, Slack groups, and niche communities
- Analyst roundups and market maps
Next, cut that list down to a focused set of 5 to 10 competitors. Use three filters:
- Directness of overlap: Do they solve the same job for the same buyer?
- Market relevance: Are they active in your segment and region?
- Learning value: Will studying them teach you something useful?
A direct rival matters more than a famous brand with weak overlap. Keep a few adjacent players if they shape buyer expectations.
Gather evidence with one consistent log
Now collect the same data points for every competitor. Consistency matters more than volume. Use public evidence from:
- Homepages and product pages
- Pricing pages and plan details
- Demo flows and signup journeys
- Help docs and knowledge bases
- Case studies and customer stories
- Review platforms
- Social posts, webinars, and public interviews
A simple evidence log keeps bias down. For each finding, record:
- Competitor name
- Topic examined
- Source URL or source name
- Exact claim or observation
- Date checked
- Confidence level: high, medium, or low
This helps you compare like with like. It also stops teams from relying on memory, screenshots without context, or gut feel.
Analyze marketing, sales, and customer sentiment
Once the evidence is logged, look for patterns. Focus on what the market actually sees.
Review each competitor's:
- Main channels used: SEO, paid search, LinkedIn, YouTube, partner marketing, outbound
- Core message: speed, cost, compliance, ease of use, AI, support
- Conversion hooks: free trial, demo, calculator, migration offer, audit
- Onboarding promise: time to value, setup simplicity, white-glove support
- Review themes: what users repeatedly praise or criticize
This is where positioning becomes clear. One brand may sell control and security. Another may win on speed and ease. Another may attract budget buyers with transparent pricing.
Score findings with a weighted rubric
Don't treat SWOT as guesswork. Turn observations into a simple scoring model first.
Example weighted rubric:
- Product depth: 30%
- Pricing clarity and value: 20%
- Positioning strength: 15%
- Demand generation reach: 15%
- Customer sentiment: 20%
Score each area on a 1 to 5 scale. Then summarize the result in SWOT form:
- Strengths: what the evidence clearly shows they do well
- Weaknesses: where they underperform or create friction
- Opportunities: unmet needs or gaps in the market
- Threats: moves that could reduce your win rate
The rubric gives your SWOT structure. It also makes trade-offs visible.
Validate missing or weak data
Not every data point will be clean. Some pricing pages are hidden. Some review pages are stale. Some claims are soft, like "best-in-class" or "loved by teams everywhere."
Flag weak evidence instead of forcing certainty. Add notes such as:
- Price unavailable; sales-led model
- Claim appears on homepage but not in docs
- Reviews are older than 12 months
- Sources conflict across pages
Then assign a confidence note to each conclusion. That makes the final report more honest and more useful.
Stay inside legal and ethical limits
Use public information. Avoid scraping where a site's terms restrict it. Don't misrepresent yourself to gain access. Respect privacy rules, customer confidentiality, and platform terms.
One important nuance: the Federal Trade Commission, Protecting Sensitive Information: A Guide for Business states that if a company publicly posts sensitive information and the information is accessed without authorization, despite the public posting, the FTC may still consider it protected and pursue action under Section 5 of the FTC Act. In practice, stick to lawful public sources and separate facts from your inferences.
End with implications, not just descriptions
A report is only useful if it drives action. Close with 3 to 5 clear implications, such as:
- Match a competitor's pricing page transparency
- Counter a repeated message in sales enablement
- Build content around gaps buyers mention in reviews
- Deprioritize a rival with low overlap and weak sentiment
If your team runs interviews, sales calls, and market research across many files, store them in one shared Project and query them together. In TicNote Cloud, teams can upload notes, transcripts, and documents, then use Shadow AI to pull cited answers across sources instead of digging through disconnected tabs and folders.
Try TicNote Cloud for Free to turn raw research into a cited report faster.
A competitive analysis report template you can copy
A good competitive analysis report should be easy to update, easy to scan, and easy to turn into action. The best format is text-first: simple enough to paste into a doc, note tool, or project workspace, but structured enough that your team can compare findings over time. Below is a practical template with clear scoring rules, an action matrix, and a refresh rhythm so the report stays useful instead of going stale.
Use a simple report structure
Keep the layout consistent each time you review the market. A strong baseline structure includes:
- Objective
- Market scope
- Competitor list
- Field checklist
- Evidence notes
- Scoring summary
- SWOT snapshot
- Key patterns
- Opportunities
- Risks
- Recommended actions
Here is a copyable text-first format:
- Objective: What decision should this report support?
- Market scope: Segment, geography, customer type, and time frame.
- Competitor list: Direct, indirect, and emerging players.
- Field checklist: Product, pricing, positioning, proof, reviews, channels, onboarding, and support.
- Evidence notes: Source, date checked, quote or observation, and confidence level.
- Scoring summary: Side-by-side scores by category.
- SWOT snapshot: Strengths, weaknesses, opportunities, threats.
- Key patterns: Repeated themes across competitors.
- Opportunities: Gaps you can exploit.
- Risks: Areas where competitors are stronger or moving faster.
- Recommended actions: Ranked next steps with owner and deadline.
If you want more formats, alternate scorecards, or a fill-in version, see this competitive analysis template guide.
Keep scoring criteria practical
Use a 1 to 5 scale. Don't overcomplicate it. The goal is consistency, not false precision.
Suggested criteria:
- Product fit
- Pricing clarity
- Differentiation
- Proof
- Customer sentiment
- Channel presence
- Sales friction
Define each score once and keep it fixed. For example, a 1 means weak or unclear, 3 means acceptable, and 5 means strong and obvious. Write a one-line rule for every category so different teammates score the same way. That's what makes a competitive analysis report template usable across quarters.
Rank actions with an impact-effort matrix
A report should lead to decisions. Score each action by impact and effort, then sort it into four buckets:
- High impact, low effort: do now
- High impact, high effort: plan next
- Low impact, low effort: optional
- Low impact, high effort: avoid
Examples include rewriting pricing pages, improving proof points, fixing onboarding friction, or testing a new comparison page. This turns research into an operating list, not an archive.
Set refresh cadence and ownership
Assign one owner, usually product marketing, strategy, or a PMM-PM pair. Review fast-changing fields monthly: pricing, homepage messaging, launches, reviews, and paid channel activity. Review slower fields quarterly: positioning, feature depth, SWOT, and strategic risks.
Always log source dates and confidence levels such as high, medium, or low. That helps your team separate verified facts from informed assumptions. If you use a workspace like TicNote Cloud, you can keep source files, draft summaries, and final outputs in one place, then turn the same research into a polished report without repetitive copy-paste.
Competitive analysis report example: a fictional SaaS workflow
A good competitive analysis report turns scattered observations into a clear point of view. To show how that works, here's a fictional SaaS example for a collaboration tool built for small agencies. The goal is simple: compare a few realistic rivals, weigh the strength of the evidence, and turn product, pricing, and positioning signals into actions a team can actually use.
Define the scenario and competitor set
Our fictional company is FlowPilot, a project and client collaboration platform for 10- to 75-person creative agencies. It competes with three tools:
- AgencyCore: a direct competitor with deep workflow controls and enterprise-style features
- TaskLite: a low-cost direct competitor for smaller teams
- ClientLoop: an adjacent competitor focused on client communication and approvals
Instead of building a giant spreadsheet, the report tracks six fields per competitor:
- Product depth
- Pricing model
- Onboarding style
- Proof points
- Review themes
- Positioning language
This is the same kind of synthesis teams use when they combine website reviews, pricing pages, sales-call notes, and interview transcripts into one narrative. If you want a second format to compare against, this competitor report blueprint shows how the structure can stay simple without losing detail.
Summarize findings across product, pricing, and positioning
Here's the condensed view:
| Competitor | Main strength | Main weakness | Evidence confidence |
| AgencyCore | Strong enterprise credibility, advanced permissions, robust reporting | Feels complex for smaller teams; setup looks heavy | High |
| TaskLite | Lowest entry price at about 40% below market median | Thin case studies, limited social proof, basic onboarding | Medium |
| ClientLoop | Sharp messaging around client visibility and fast approvals | Review sentiment flags slow support and inconsistent issue resolution | Medium |
A few patterns stand out fast. AgencyCore looks trustworthy because it has detailed feature pages, security language, and named customer logos. But its onboarding flow asks users to configure templates, roles, and automations early. That raises friction.
TaskLite wins attention on price. But lower pricing alone is not a durable edge when proof is weak. Its homepage claims speed and simplicity, yet there are few detailed testimonials or use-case stories to back that up.
ClientLoop has the clearest positioning. Its language is easy to understand in under 10 seconds. Still, review themes suggest support quality may undercut the promise.
Form the final recommendation from mixed-confidence evidence
The final recommendation is not "cut price." It is to target the underserved mid-market agency buyer: teams that need client-friendly collaboration without enterprise overhead. That leads to three actions:
- Simplify the homepage message around client delivery and internal coordination
- Package mid-tier plans around approvals, timelines, and stakeholder access
- Use proof assets that show fast setup and responsive support
Confidence labels matter here. Pricing and homepage claims are usually high-confidence because they are public. Review summaries may be medium-confidence because sentiment can skew negative. Sales-call notes may be low- to medium-confidence unless repeated across several calls. A strong report marks those differences clearly so leaders know what to act on now and what to validate next.
How should you present and visualize competitive analysis?
A strong competitive analysis report becomes more useful when people can scan it fast and act on it. The goal is simple: match each finding to the clearest visual, then turn the report into a short story that ends with decisions. If you need a stronger method before building slides, this guide on turning research into strategy can help.
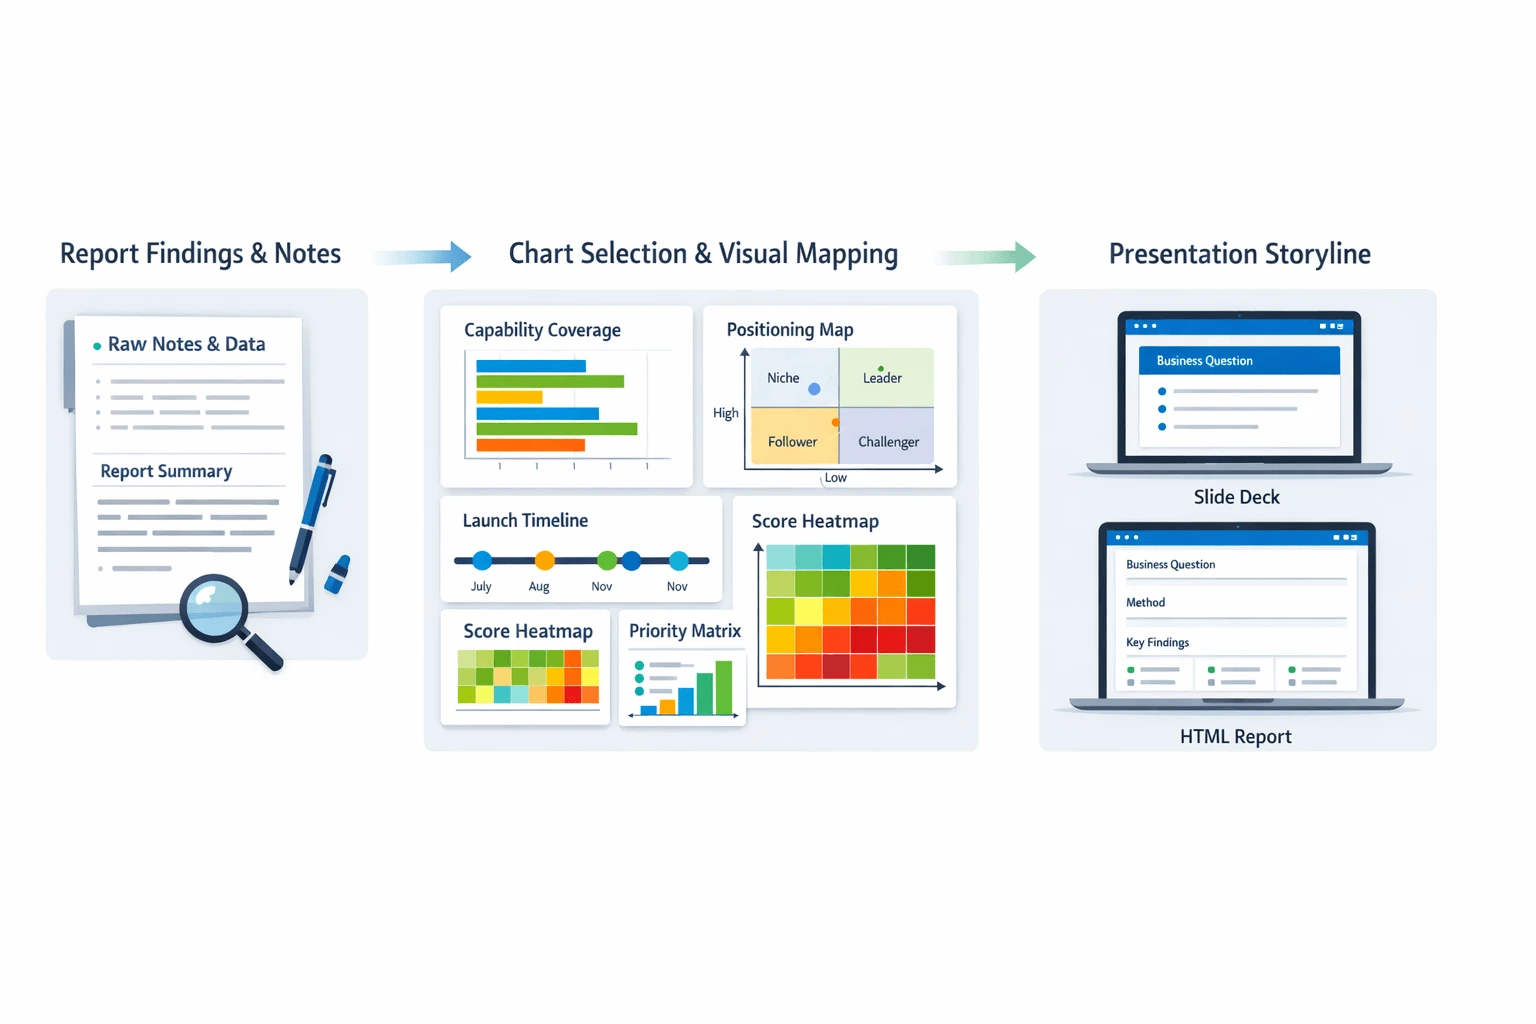
Pick the right chart for the job
Use visuals that fit the insight, not the other way around:
- Comparison bars: best for feature or capability coverage across a small competitor set.
- Quadrant maps: good for positioning, such as price vs. depth of service.
- Timeline views: useful for product launches, pricing changes, or major messaging shifts.
- Heatmaps: ideal for showing score patterns across many criteria.
- Priority matrices: best for turning findings into action based on impact and effort.
Build a deck that leads to decisions
A competitive analysis presentation should move in a tight order:
- Start with the business question.
- Define the competitor set and research method.
- Show the 3 to 5 findings that matter most.
- End with decisions, risks, and next steps.
Keep one takeaway per slide. Use plain labels, clear legends, and source notes with dates. That makes the analysis easier to trust and easier to update.
Avoid the slide mistakes that weaken the message
The most common problems are predictable:
- Too many competitors on one slide
- Facts mixed with assumptions
- Logo walls that add clutter
- Scores with no clear scale
- Missing source dates
- Observations with no business implication
Don't over-design it. A simple deck with consistent colors and short captions usually beats a polished but confusing one. Modern workflows also help here: a text-first report can be turned into a competitive analysis presentation much faster, including shareable HTML-style outputs for teams that don't want to rebuild every slide by hand.
What this workflow can do that manual research cannot
Manual competitor research breaks down in the same places again and again. Notes get split across calls, docs, and tabs. Quotes are copied into slides with no source trail. Teams re-read the same material to rebuild a competitive analysis report from scratch. Then they spend another round turning research into something presentable.
OECD Employment Outlook 2024 found that in 2023, workers in finance and insurance spent 2.0 hours per day in meetings on average. That volume makes fragmented follow-up expensive.
Keep project memory in one place
A modern workspace solves the first problem: scattered inputs. Instead of storing interview notes in one tool, sales call transcripts in another, and review research in a spreadsheet, teams can keep them in one project. In TicNote Cloud, that means competitor interviews, internal calls, PDFs, and web research can sit together in a shared workspace. The benefit is simple: your report starts from a living evidence base, not a pile of exports.
Get answers with citations
The next bottleneck is traceability. Manual workflows often lose the link between insight and source. Shadow AI addresses that by answering questions across project files with clickable citations. So if a stakeholder asks, "Which competitor keeps winning on onboarding?" you can trace the answer back to the exact transcript, note, or file.
Edit the evidence instead of freezing it
Most transcripts are treated like locked archives. That slows synthesis. Editable transcripts let researchers clean wording, tag themes, and refine proof points as patterns emerge. In practice, that makes collaboration faster because the team improves the evidence directly instead of copying fragments into new documents.
Move from research to presentation faster
The final gap is handoff. Research often lives in notes while presentation lives somewhere else. One-click report and HTML presentation outputs close that gap. You go from raw inputs to a stakeholder-ready summary without rebuilding the same story twice.
If you want a faster way to test this process, try it on one competitor set first, then expand once the workflow proves useful.
Try TicNote Cloud for free and build your first cited competitor report faster.
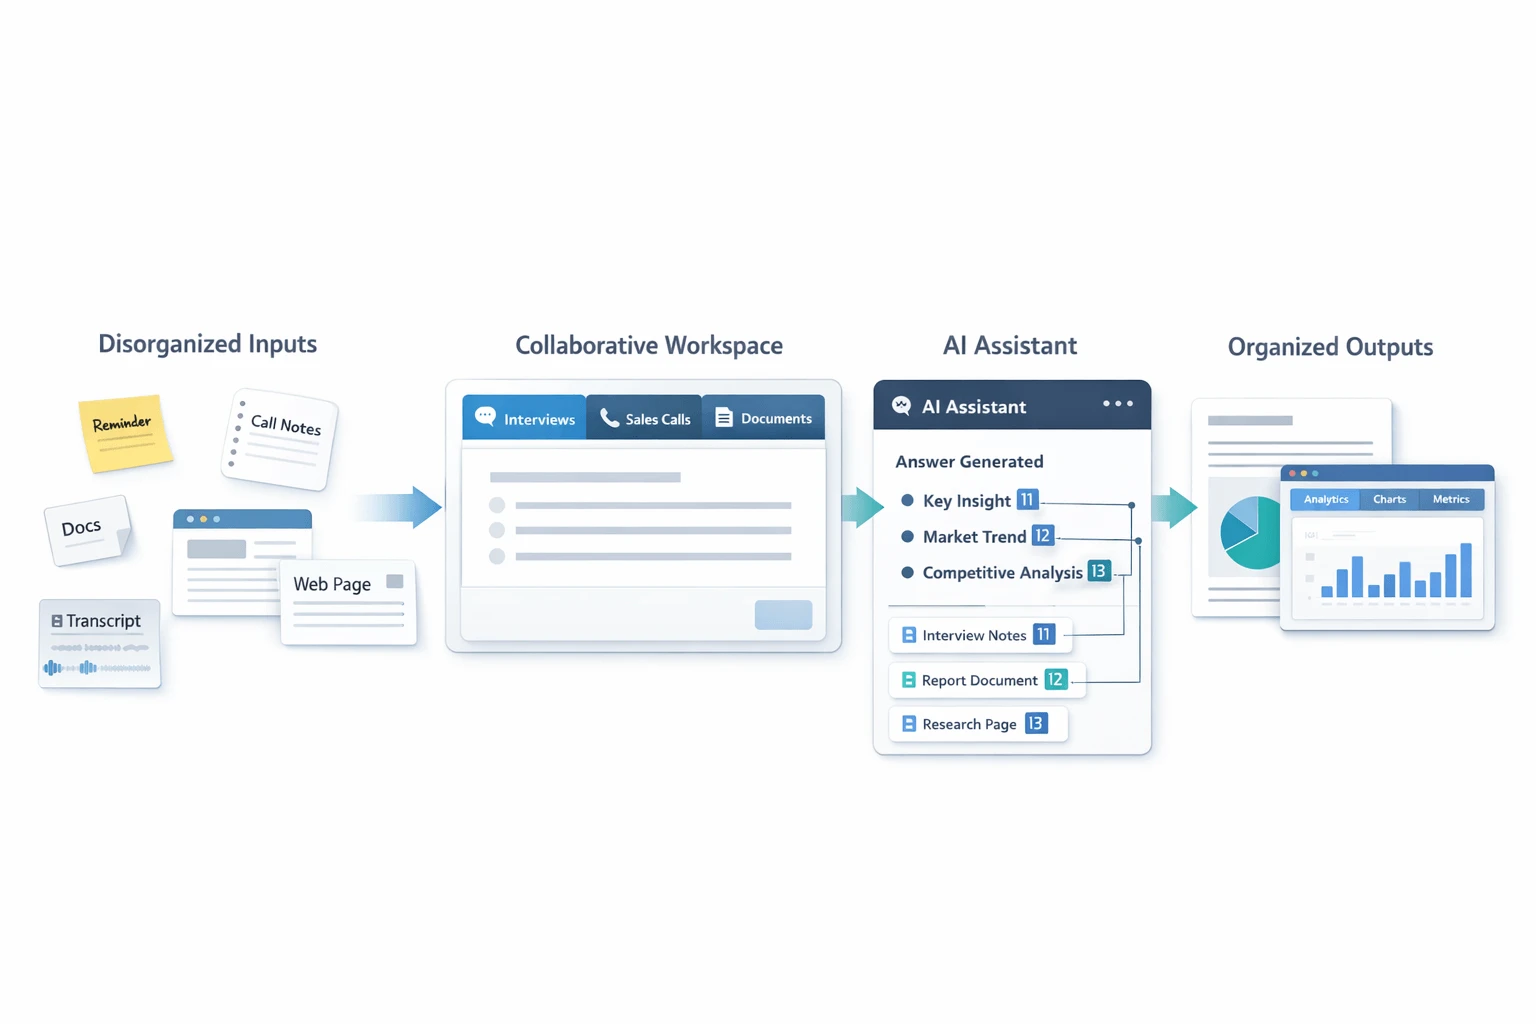
Using an AI research workflow to build a report from raw notes
To make this concrete, this section uses TicNote Cloud as the example workflow. The goal is simple: turn raw notes, interviews, sales calls, and public-source research into a competitive analysis report and a visual matrix without rebuilding everything by hand.
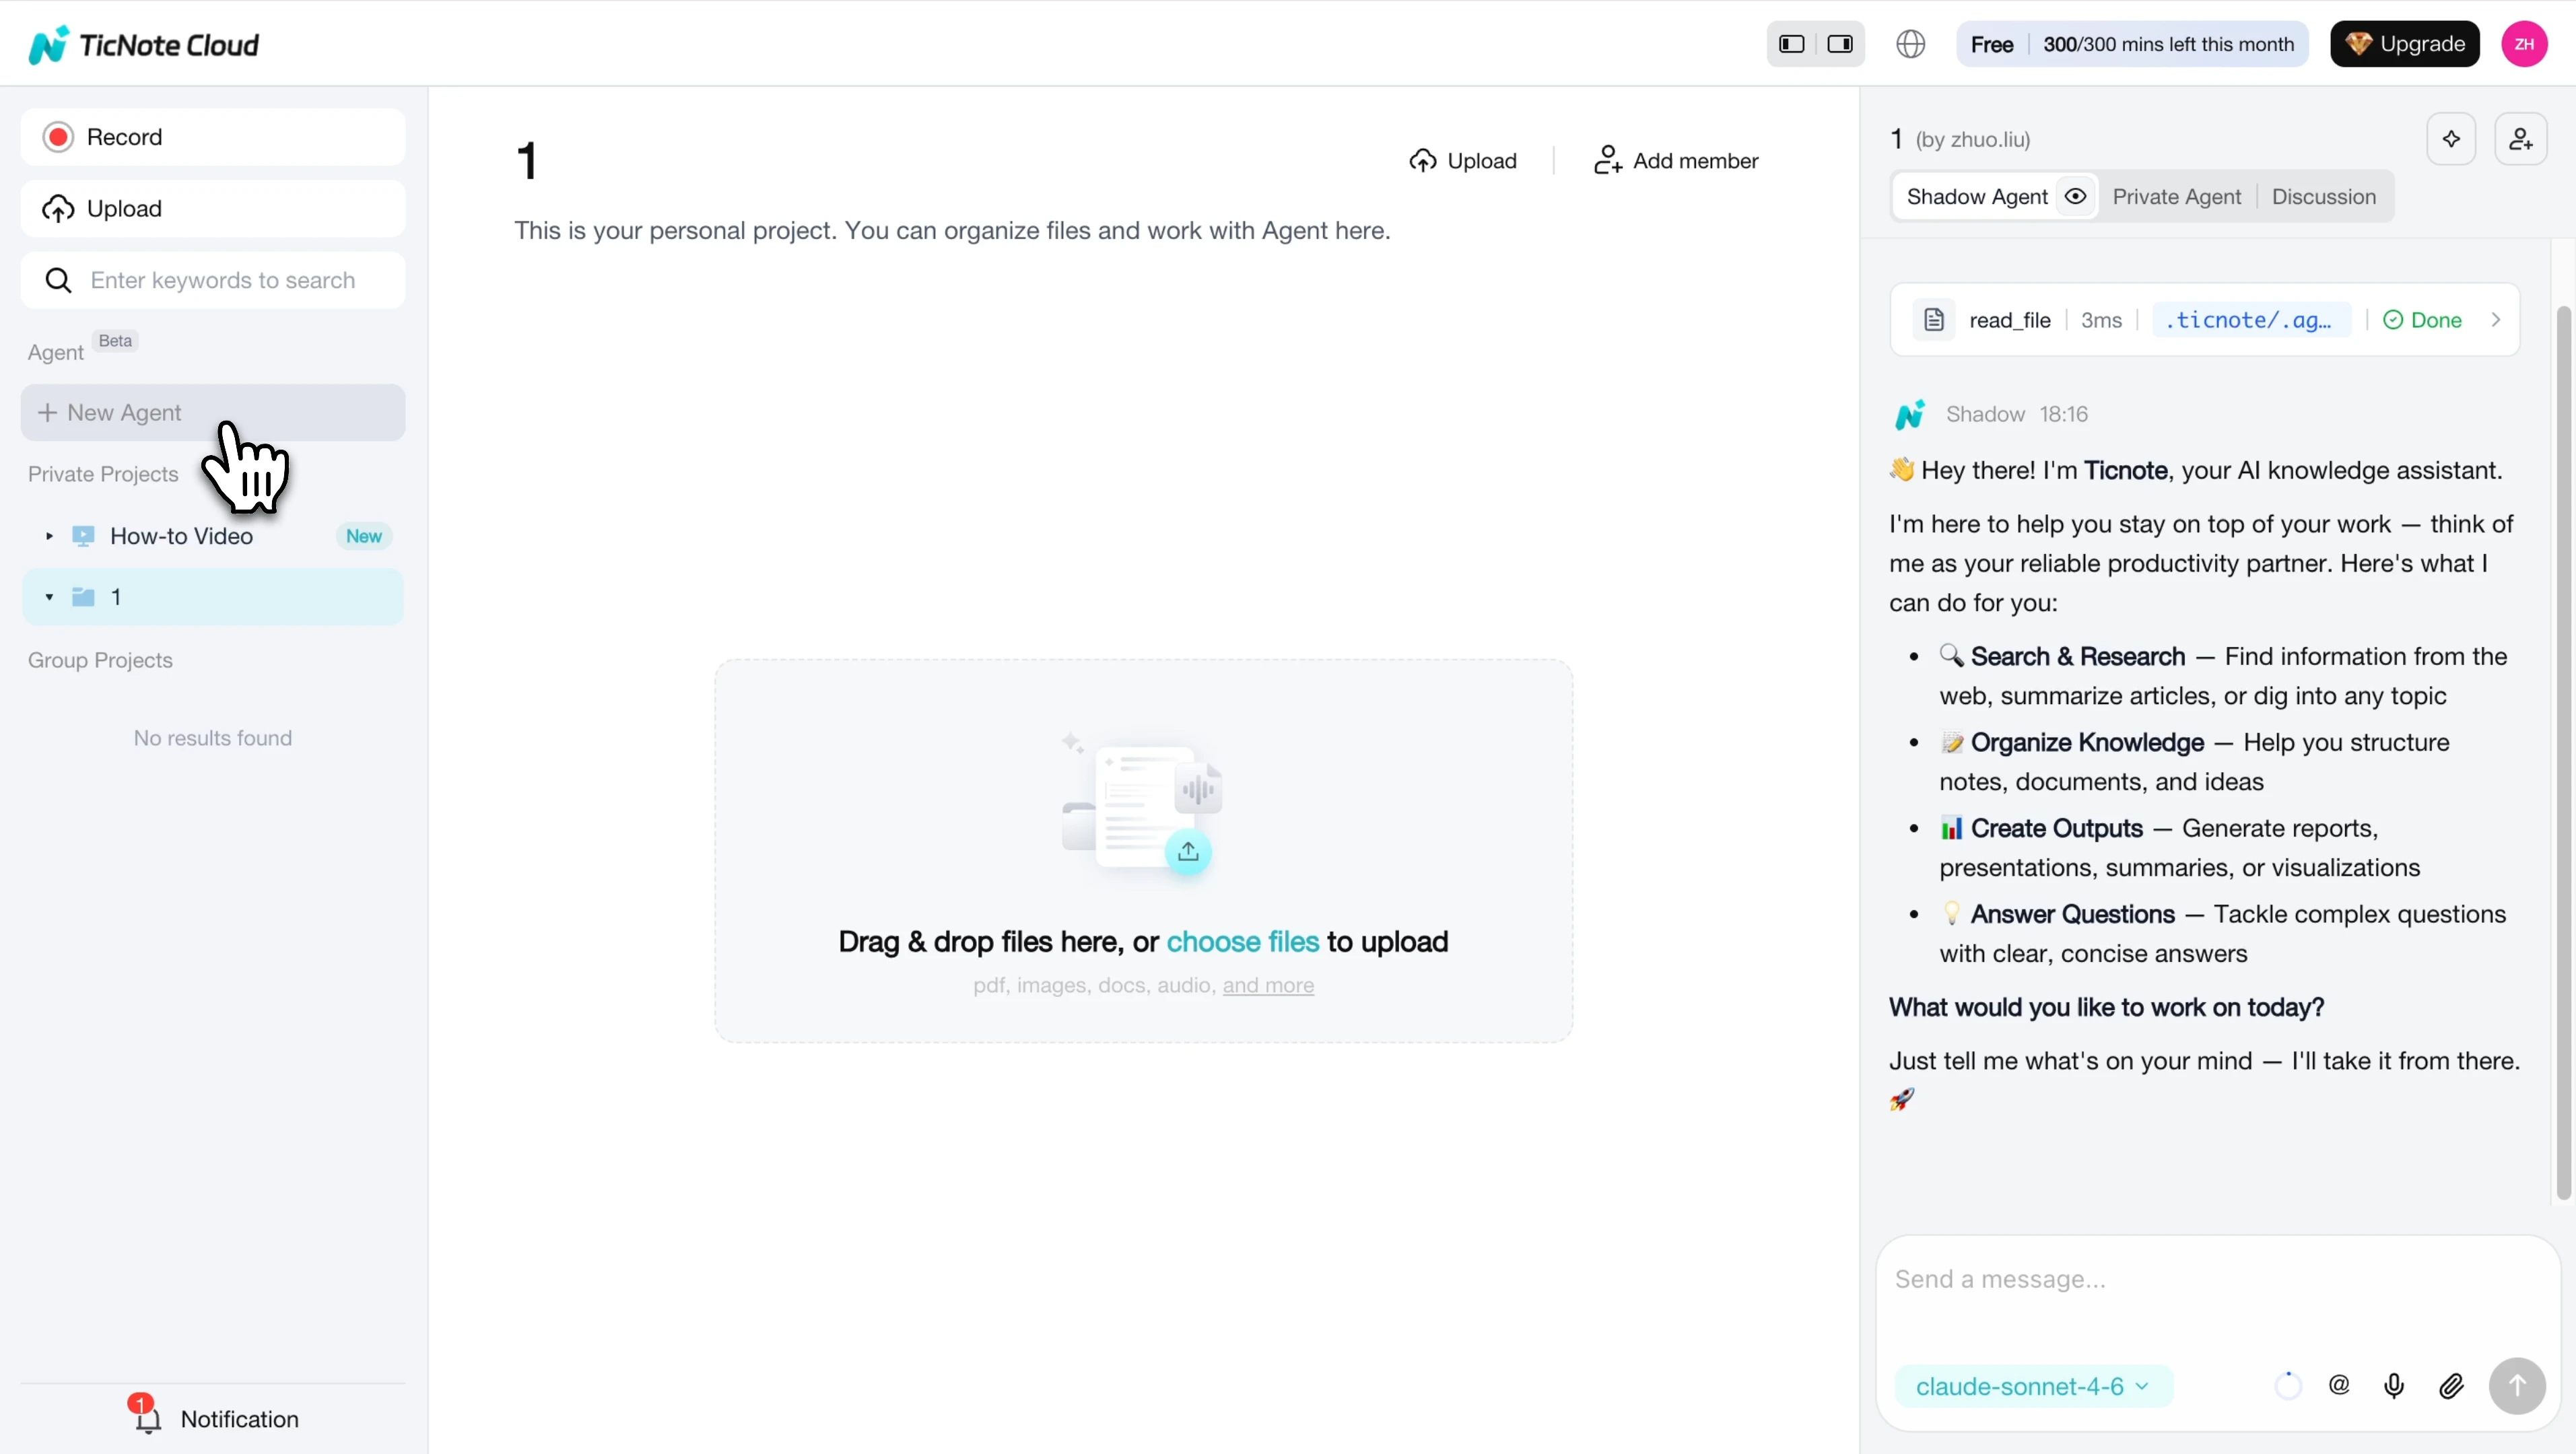
Build the report on web first
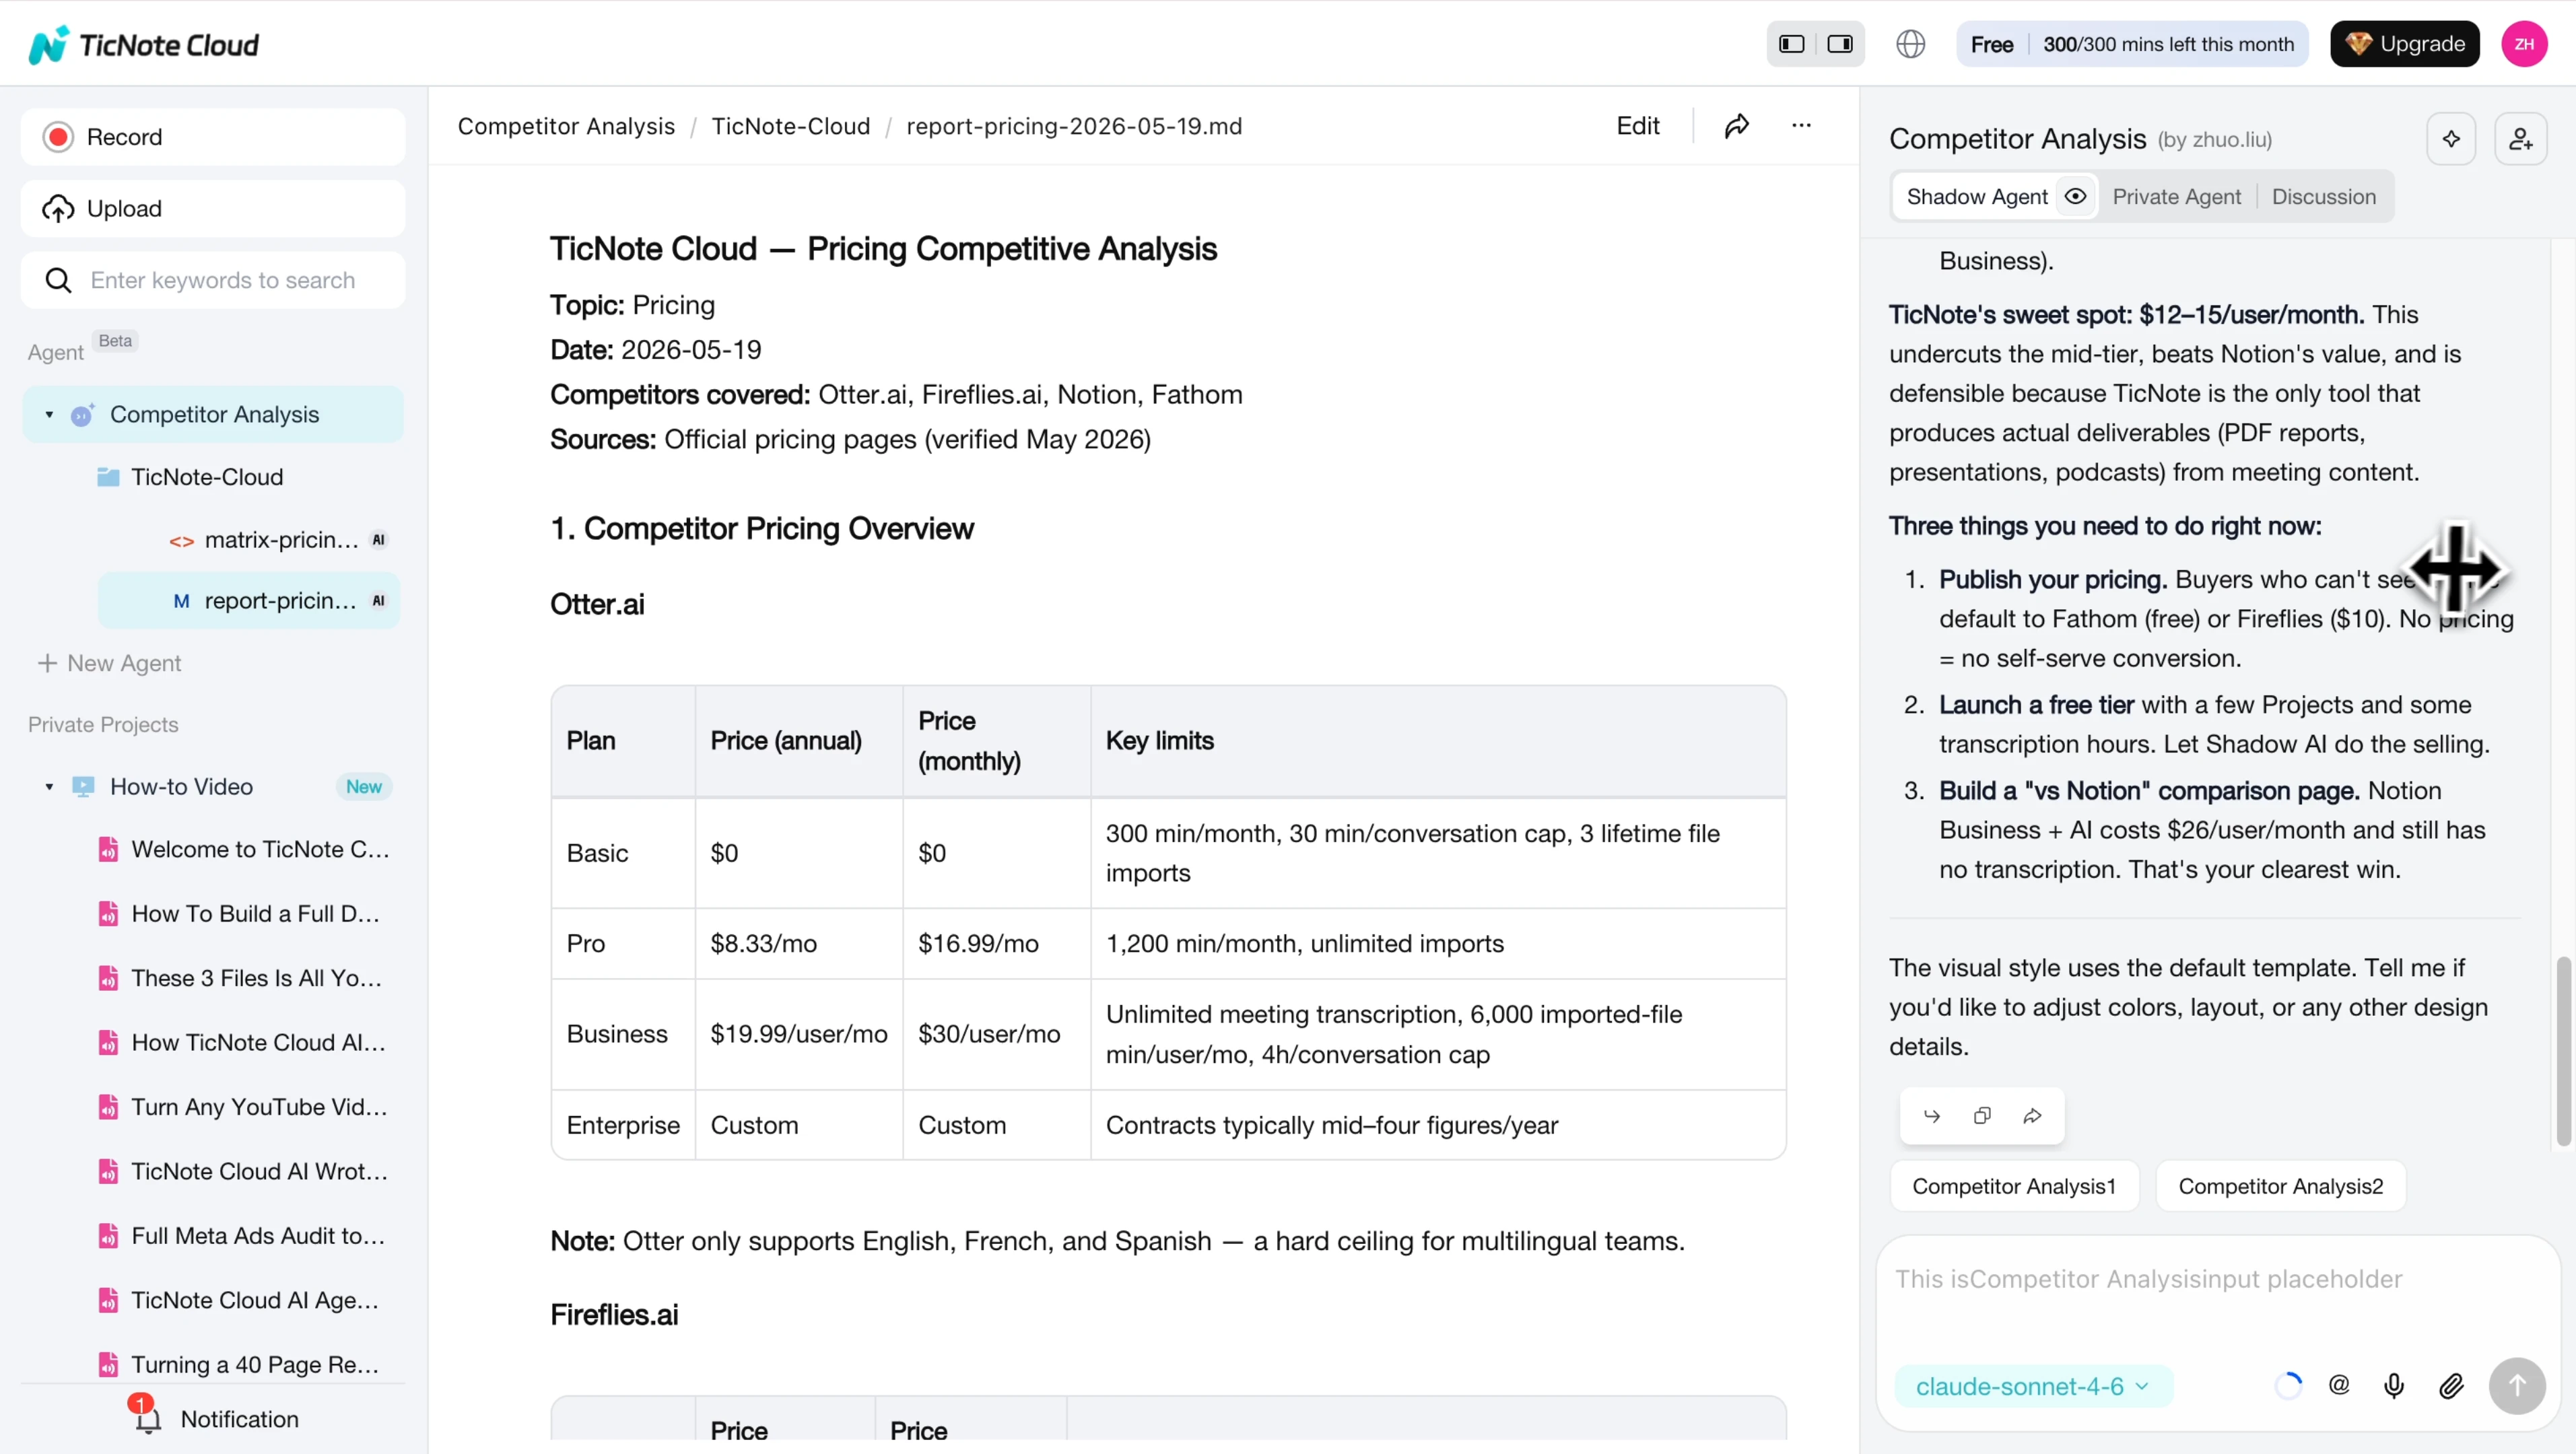
Start in the web workspace by adding the Competitor Analysis skill agent to your setup. In practice, this gives you a structured path for creating a report instead of working from a blank page.
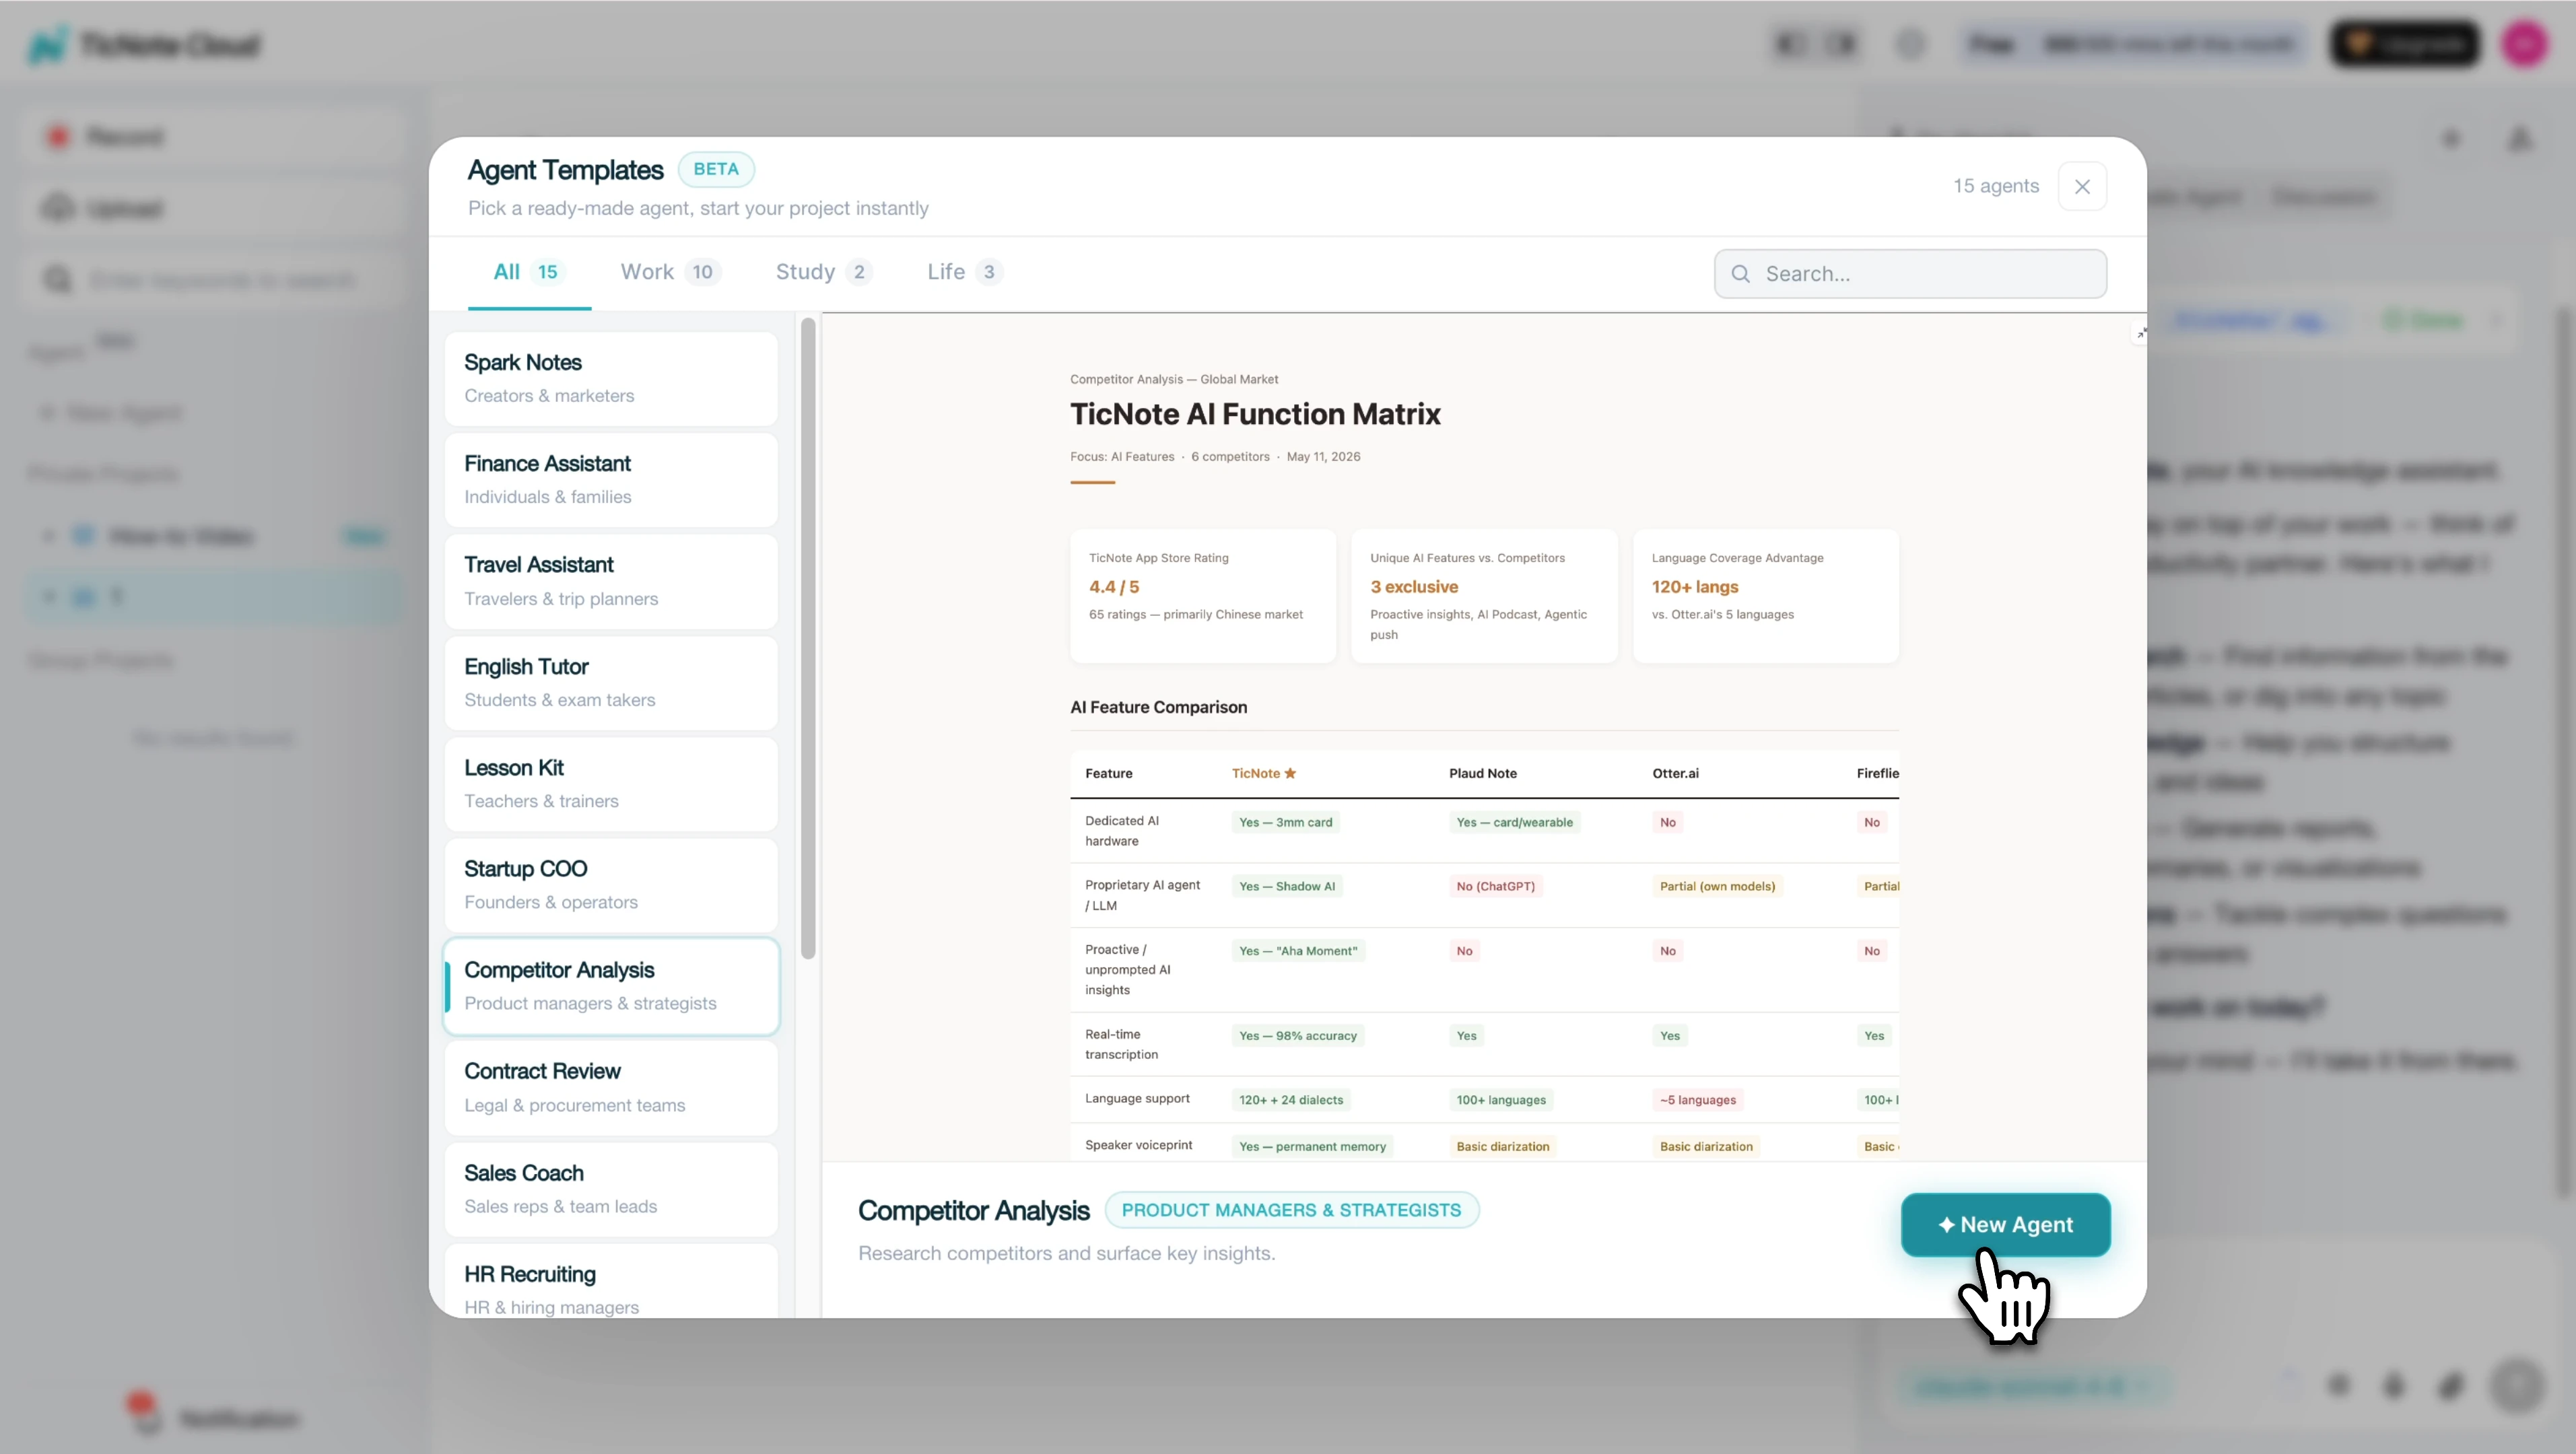
After that, select the competitor analysis skill and open it inside the right workspace.
Next, create or open a Project for the market, segment, or region you want to study. Then enter the niche, location, and five to ten competitor names or URLs. If needed, add a focus such as pricing, reviews, social media, or product range so the output stays tight.
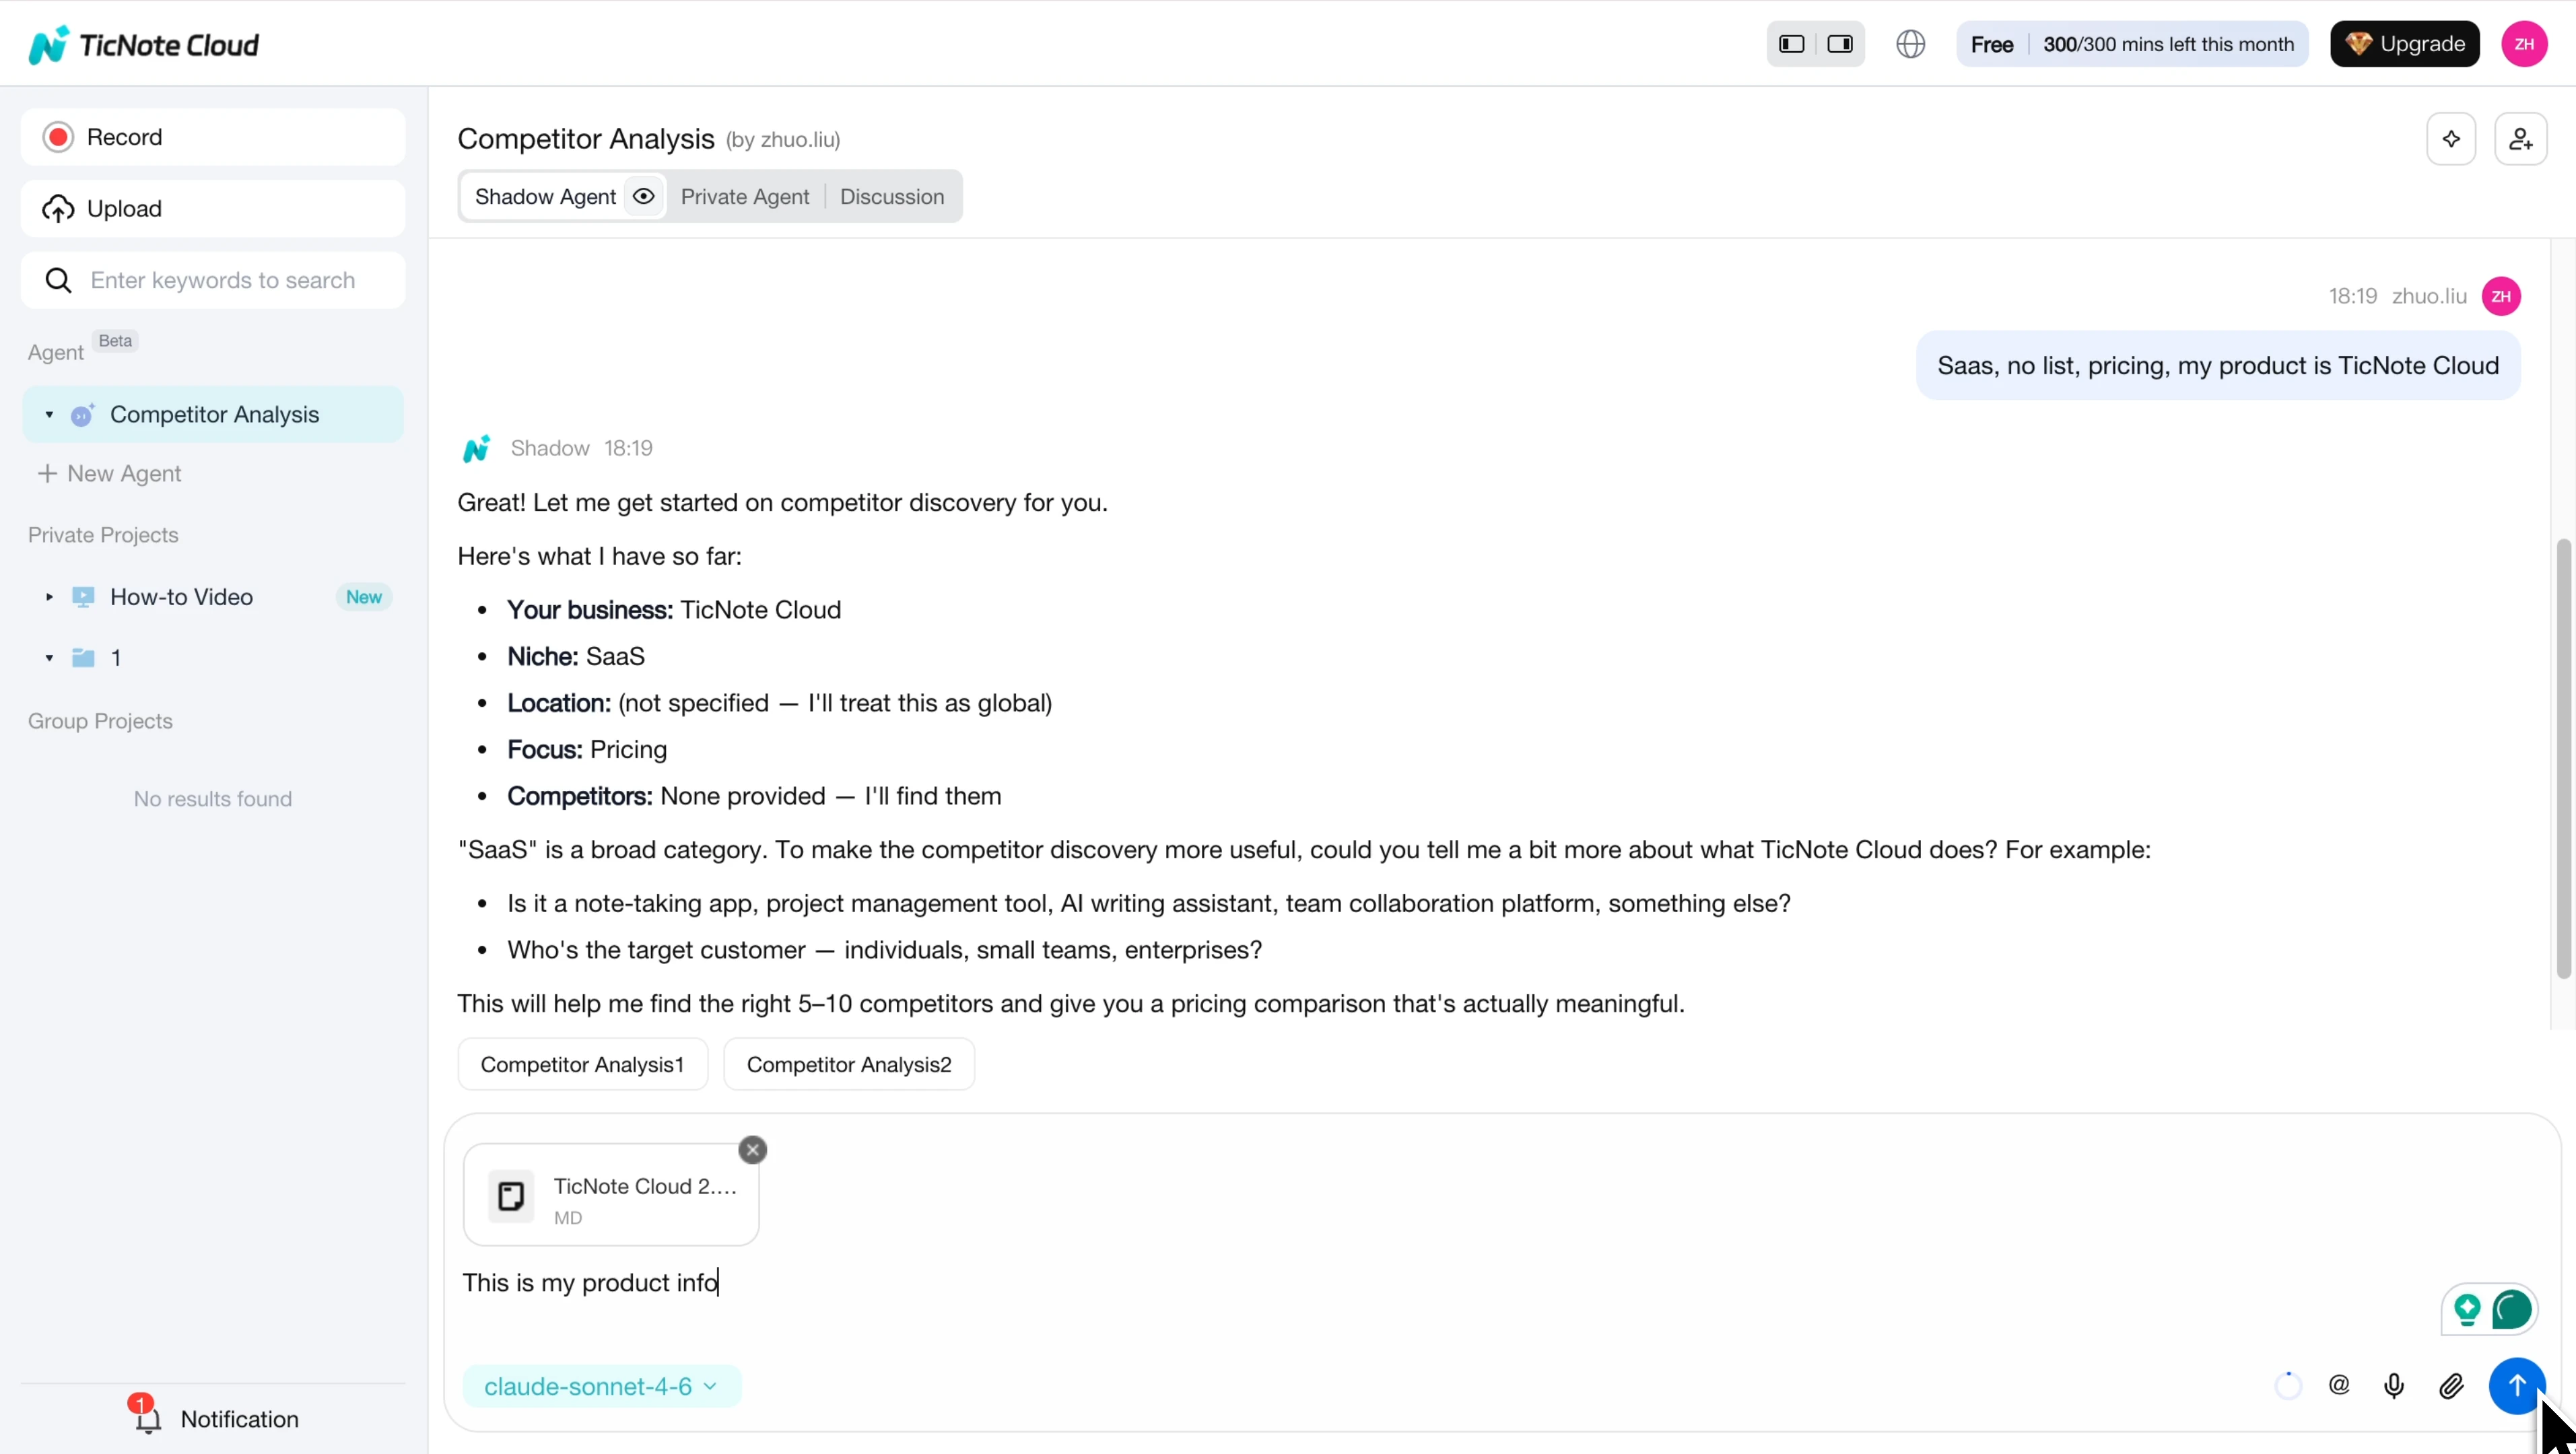
From there, add your source material: interview notes, sales-call transcripts, review summaries, pricing pages, or other research files. Ask the AI assistant to generate a structured report with an executive summary, comparison table, competitor profiles, market gaps, and recommended actions.
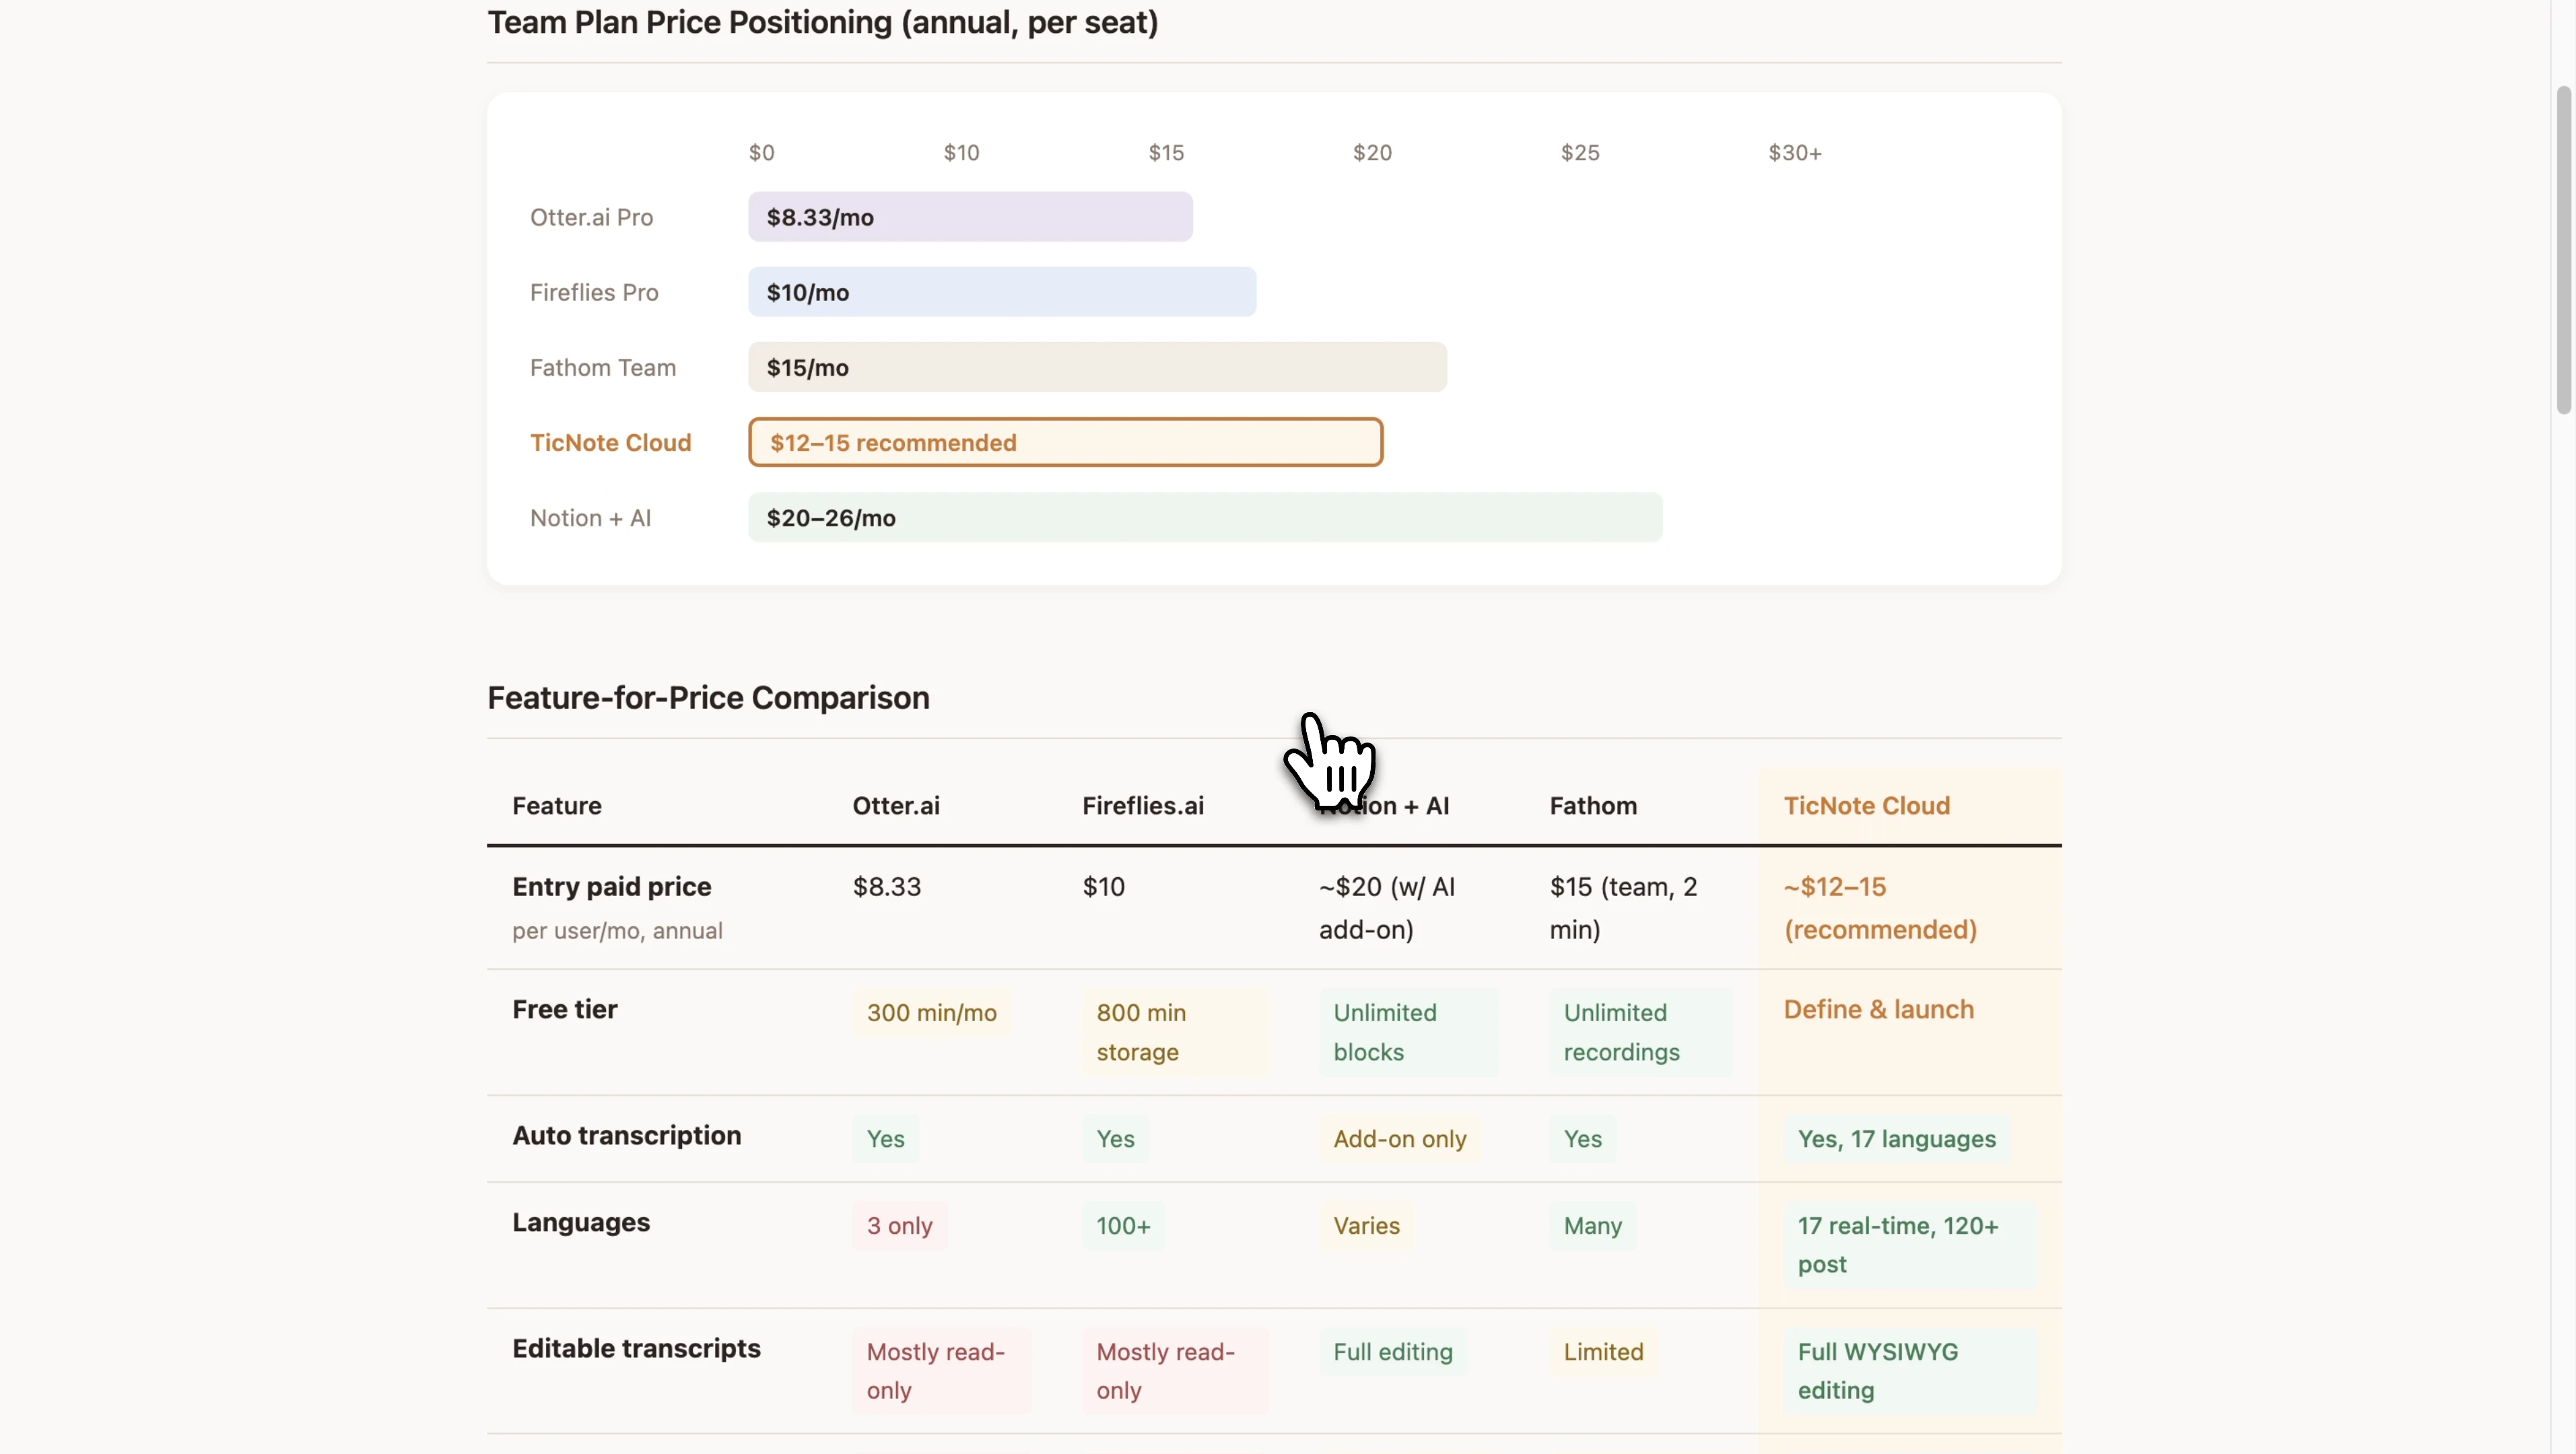
The same workflow can also create a visual HTML comparison matrix, which is useful when you need a competitive analysis presentation fast.
Continue from the app without losing context
On mobile, capture notes or meeting content in the app, then send them into the same Project. Later, continue the synthesis on the web with the full context still attached. In the final article, screenshots should show where to add competitors, how to set the research focus, and where both the report and matrix appear.
Final thoughts
A strong competitive analysis report should drive decisions, not just store facts. The best reports stay focused on one core question, compare the right competitors, use the same evidence fields for each company, and turn findings into a short list of actions a team can actually take.
Use this simple review checklist before you share it:
- define the decision the report supports
- compare direct and realistic alternatives
- score with clear criteria, not guesswork
- flag weak signals and validate them later
- assign one owner for updates and next steps
- refresh the report on a regular cadence
That keeps the work useful over time, especially as pricing, features, and positioning shift fast. Try TicNote Cloud for free to turn calls, notes, and documents into cited reports and presentation-ready outputs faster.